
| |||||||||||||||||||||||||||||
1,098 delegates to the 1928 Democratic National Convention 732 (two-thirds) votes needed to win | |||||||||||||||||||||||||||||
|---|---|---|---|---|---|---|---|---|---|---|---|---|---|---|---|---|---|---|---|---|---|---|---|---|---|---|---|---|---|
| |||||||||||||||||||||||||||||
 First place by convention roll call Smith Hull George Various | |||||||||||||||||||||||||||||
| |||||||||||||||||||||||||||||


From March 6 to May 18, 1928, voters of the Democratic Party elected delegates to the 1928 Democratic National Convention, for the purpose of choosing the party's nominee for president in the 1928 election.[1]
In sharp contrast to the three previous open nominations, the delegate selections were all-but-conclusive in favor of New York governor Al Smith, who entered the convention only a few votes short of the required two-thirds majority; he won on the first ballot after several delegates shifted to him. Smith was the first Catholic nominated by a major party for President of the United States and the first non-incumbent Democrat to win his party's nomination on the first ballot since 1908.
Despite his easy nomination, his failure to carry most Southern states was a sign of things to come; Smith lost the general election to Herbert Hoover in a landslide, with many Southern voters defecting to the Republican Party over their opposition to Smith's Catholic faith.
Candidates
Nominee
| Candidate | Most recent position | Home state | Campaign | Popular vote | Contests won | Running mate | ||
|---|---|---|---|---|---|---|---|---|
| Al Smith | 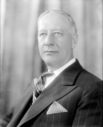
|
42nd Governor of New York (1919–20, 1923–28) |
 New York |
(Campaign • Positions) Secured nomination: June 26-28, 1928 |
559,265 (41.7%) |
[data missing] | Joseph Taylor Robinson | |
Withdrew during convention
| Candidate | Most recent position | Home state | Campaign | Popular vote | Contests won | ||
|---|---|---|---|---|---|---|---|
| Walter F. George | 
|
U.S. Senator from Georgia (1922–1957) |
Georgia |
— | AL, FL, GA | ||
| Cordell Hull | U.S. Representative from Tennessee (1907–21, 1923–31) |
Tennessee |
— | NC, TN, VA | |||
| James A. Reed | 
|
U.S. Senator from Missouri (1911–1929) |
 Missouri |
207,455 (15.5%) |
[data missing] | ||
| Thomas J. Walsh | 
|
U.S. Senator from Montana (1913–1933) |
Montana |
101,305 (7.6%) |
[data missing] | ||
Favorite sons
The following candidates ran only in their home state's primary or caucus for the purpose of controlling its delegate slate at the convention and did not appear to be considered national candidates by the media.
- Governor A. Victor Donahey of Ohio
- U.S. Senator Pat Harrison of Mississippi
- Former U.S. Senator Gilbert Hitchcock of Nebraska
- Businessman Jesse H. Jones of Texas
- Former U.S. Senator Atlee Pomerene of Ohio
- Banker Evans Woollen of Indiana
- Chief Justice Richard C. Watts of South Carolina
Primaries
| Al Smith |
James Reed |
Evans Woollen |
Thomas Walsh |
Gilbert Hitchcock |
Atlee Pomerene |
Victor Donahey |
Uncommitted | Others | ||
| March 6 | South Dakota (Caucus) |
51.56% (43,876) |
- | - | 48.44% (41,213) |
- | - | - | - | - |
| March 13 | New Hampshire (Primary) |
100.00% (9,716) |
- | - | - | - | - | - | - | - |
| March 20 | North Dakota (Primary) |
100.00% (10,822) |
- | - | - | - | - | - | - | - |
| April 2 | Michigan (Primary) |
98.27% (77,276) |
0.41% (324) |
- | 1.32% (1,034) |
- | - | - | - | - |
| April 3 | Wisconsin (Primary) |
23.88% (W) (19,781) |
73.76% (61,097) |
- | 0.65% (W) (541) |
- | - | - | - | 1.70% (W) (1,410) |
| April 10 | Illinois (Primary) |
90.77% (W) (44,212) |
7.77% (W) (3,786) |
- | 0.45% (W) (221) |
- | - | - | - | 1.01% (W) (490) |
| Nebraska (Primary) |
8.53% (W) (4,755) |
- | - | - | 91.48% (W) (51,019) |
- | - | - | - | |
| April 24 | Ohio (Primary) |
64.89% (42,365) |
- | - | - | - | 21.38% (13,957) |
12.15% (7,935) |
- | - |
| April 28 | Massachusetts (Primary) |
98.11% (W) (38,081) |
- | - | 0.65% (W) (254) |
- | - | - | - | 1.23% (W) (478) |
| May 1 | California (Primary) |
55.74% (134,471) |
24.87% (60,004) |
- | 19.39% (46,770) |
- | - | - | - | - |
| May 7 | Indiana (Primary) |
- | - | 100.00% (146,934) |
- | - | - | - | - | - |
| May 8 | Alabama (Primary) |
- | - | - | - | - | - | - | 100.00% (138,957) |
- |
| May 15 | New Jersey (Primary) |
99.03% (28,506) |
0.31% (W) (88) |
- | - | - | - | - | - | 0.66% (W) (190) |
| May 18 | Oregon (Primary) |
48.51% (17,444) |
17.69% (6,360) |
- | 31.35% (11,272) |
- | - | - | - | - |
| May 22 | South Dakota (Primary) |
100.00% (6,221) |
- | - | - | - | - | - | - | - |
| May 29 | West Virginia (Primary) |
50.05% (81,739) |
46.41% (75,796) |
- | - | - | - | - | - | 31.35% (11,272) |
| June 5 | Florida (Primary) |
- | - | - | - | - | - | - | 100.00% (108,167) |
- |
| Legend: | 1st place (popular vote) |
2nd place (popular vote) |
3rd place (popular vote) |
Candidate has Withdrawn or Ceased Campaigning |
(W) - Votes are Write-In |
|---|
See also
References
- ^ Kalb, Deborah (2016-02-19). Guide to U.S. Elections - Google Books. ISBN 9781483380353. Retrieved 2016-02-19.