| |||||||||||||||||||||||||||||||||
| |||||||||||||||||||||||||||||||||
 County Results
| |||||||||||||||||||||||||||||||||
| |||||||||||||||||||||||||||||||||


| Elections in Maryland |
|---|
 |
|
|
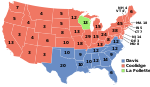
The 1924 United States presidential election in Maryland took place on November 4, 1924. All contemporary 48 states were part of the 1924 United States presidential election. State voters chose 8 electors to the Electoral College, which selected the president and vice president.
Maryland was won by the Republican nominee, incumbent President Calvin Coolidge of Massachusetts, over the Democratic nominee, Ambassador John W. Davis of West Virginia. Coolidge ran with former Budget Director Charles G. Dawes of Illinois, while Davis ran with Governor Charles W. Bryan of Nebraska. Also in the running that year was the Progressive Party nominee, Senator Robert M. La Follette of Wisconsin and his running mate Senator Burton K. Wheeler of Montana.
In this election, Maryland voted 21.22% more Democratic than the nation at large, or an 8 percent bigger differential than in 1920.[1]
YouTube Encyclopedic
-
1/5Views:164 854133 615178 300146 455154 149
-
The American Presidential Election of 1924
-
The American Presidential Election of 1928
-
The American Presidential Election of 1920
-
The American Presidential Election of 1904
-
Top 10 Presidential Candidates in American History
Transcription
Results
| Presidential Candidate | Running Mate | Party | Electoral Vote (EV) | Popular Vote (PV) | |
|---|---|---|---|---|---|
| Calvin Coolidge of Massachusetts | Charles G. Dawes | Republican | 8[2] | 162,414 | 45.29% |
| John W. Davis | Charles W. Bryan | Democratic | 0 | 148,072 | 41.29% |
| Robert M. La Follette | Burton K. Wheeler | Progressive | 0 | 47,157 | 13.15% |
| Frank Tetes Johns | Verne L. Reynolds | Labor | 0 | 987 | 0.28% |
Results by county
| County | John Calvin Coolidge Republican |
John William Davis Democratic |
Robert Marion La Follette, Sr. Progressive |
Frank Tetes Johns Labor |
Margin | Total votes cast[3] | |||||
|---|---|---|---|---|---|---|---|---|---|---|---|
| # | % | # | % | # | % | # | % | # | % | ||
| Allegany | 9,042 | 55.24% | 4,442 | 27.14% | 2,822 | 17.24% | 64 | 0.39% | 4,600 | 28.10% | 16,370 |
| Anne Arundel | 3,670 | 44.46% | 3,766 | 45.62% | 758 | 9.18% | 61 | 0.74% | -96 | -1.16% | 8,255 |
| Baltimore | 9,383 | 43.32% | 9,424 | 43.51% | 2,824 | 13.04% | 30 | 0.14% | -41 | -0.19% | 21,661 |
| Baltimore City | 69,588 | 42.63% | 60,222 | 36.89% | 32,958 | 20.19% | 484 | 0.30% | 9,366 | 5.74% | 163,252 |
| Calvert | 1,564 | 54.06% | 1,242 | 42.93% | 84 | 2.90% | 3 | 0.10% | 322 | 11.13% | 2,893 |
| Caroline | 2,210 | 45.21% | 2,493 | 51.00% | 165 | 3.38% | 20 | 0.41% | -283 | -5.79% | 4,888 |
| Carroll | 5,301 | 51.65% | 4,616 | 44.98% | 320 | 3.12% | 26 | 0.25% | 685 | 6.67% | 10,263 |
| Cecil | 3,156 | 50.37% | 2,863 | 45.69% | 213 | 3.40% | 34 | 0.54% | 293 | 4.68% | 6,266 |
| Charles | 2,215 | 56.59% | 1,491 | 38.09% | 177 | 4.52% | 31 | 0.79% | 724 | 18.50% | 3,914 |
| Dorchester | 3,356 | 50.76% | 3,047 | 46.08% | 203 | 3.07% | 6 | 0.09% | 309 | 4.67% | 6,612 |
| Frederick | 8,441 | 49.35% | 7,740 | 45.25% | 903 | 5.28% | 22 | 0.13% | 701 | 4.10% | 17,106 |
| Garrett | 2,594 | 61.79% | 1,226 | 29.20% | 373 | 8.89% | 5 | 0.12% | 1,368 | 32.59% | 4,198 |
| Harford | 3,545 | 45.69% | 3,841 | 49.51% | 355 | 4.58% | 17 | 0.22% | -296 | -3.82% | 7,758 |
| Howard | 1,989 | 38.48% | 2,786 | 53.90% | 382 | 7.39% | 12 | 0.23% | -797 | -15.42% | 5,169 |
| Kent | 2,019 | 42.51% | 2,628 | 55.34% | 94 | 1.98% | 8 | 0.17% | -609 | -12.82% | 4,749 |
| Montgomery | 5,675 | 44.01% | 6,639 | 51.49% | 557 | 4.32% | 23 | 0.18% | -964 | -7.48% | 12,894 |
| Prince George's | 5,868 | 46.98% | 5,088 | 40.74% | 1,477 | 11.83% | 57 | 0.46% | 780 | 6.24% | 12,490 |
| Queen Anne's | 1,656 | 33.74% | 3,155 | 64.28% | 82 | 1.67% | 15 | 0.31% | -1,499 | -30.54% | 4,908 |
| St. Mary's | 1,653 | 44.64% | 1,949 | 52.63% | 93 | 2.51% | 8 | 0.22% | -296 | -7.99% | 3,703 |
| Somerset | 3,230 | 51.19% | 2,903 | 46.01% | 152 | 2.41% | 25 | 0.40% | 327 | 5.18% | 6,310 |
| Talbot | 2,451 | 44.66% | 2,859 | 52.10% | 176 | 3.21% | 2 | 0.04% | -408 | -7.43% | 5,488 |
| Washington | 7,460 | 54.21% | 4,620 | 33.57% | 1,654 | 12.02% | 28 | 0.20% | 2,840 | 20.64% | 13,762 |
| Wicomico | 2,604 | 43.82% | 3,068 | 51.62% | 269 | 4.53% | 2 | 0.03% | -464 | -7.81% | 5,943 |
| Worcester | 3,744 | 38.29% | 5,964 | 60.99% | 66 | 0.67% | 4 | 0.04% | -2,220 | -22.70% | 9,778 |
| Totals | 162,414 | 45.29% | 148,072 | 41.29% | 47,157 | 13.15% | 987 | 0.28% | 14,342 | 4.00% | 358,630 |
Counties that flipped from Republican to Democratic
Counties that flipped from Democratic to Republican
See also
- United States presidential elections in Maryland
- 1924 United States presidential election
- 1924 United States elections
References
- ^ "Dave Leip's Atlas of U.S. Presidential Elections". uselectionatlas.org. Retrieved March 26, 2023.
- ^ "1924 Presidential General Election Results – Maryland". Dave Leip’s U.S. Election Atlas.
- ^ Maryland State Board of Elections; Maryland Manual 1925 pp. 203-206 ‘General Election November 4, 1924’