| ||||||||||||||||||||||||||
| ||||||||||||||||||||||||||
 County Results
| ||||||||||||||||||||||||||
| ||||||||||||||||||||||||||


| Elections in South Carolina |
|---|
 |
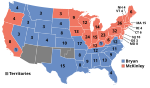
The 1896 United States presidential election in South Carolina took place on November 3, 1896, as part of the 1896 United States presidential election. Voters chose nine representatives, or electors to the Electoral College, who voted for president and vice president.
South Carolina overwhelmingly voted for the Democratic nominee, former U.S. Representative from Nebraska William Jennings Bryan, over the Republican nominee, former governor of Ohio William McKinley. Bryan won the state by a landslide margin of 71.79%. However, McKinley's performance would actually prove to be a high water mark for Republicans going into the 20th century; he was the last Republican to win even 10% of the state's vote until Dwight D. Eisenhower in 1952.
With 85.3% of the popular vote, South Carolina would prove to be Bryan's second strongest state in the 1896 presidential election only after Mississippi.[1]
Bryan would later defeat McKinley in South Carolina again four years later and would win the state again in 1908 against William Howard Taft.
YouTube Encyclopedic
-
1/5Views:223 84667736 323493 163204 717
-
The American Presidential Election of 1896
-
United States presidential election, 1896
-
Can I win as WILLIAM JENNINGS BRYAN in 1896??? Let's Find Out
-
The American Presidential Election of 1860
-
The American Presidential Election of 1832
Transcription
Results
| 1896 United States presidential election in South Carolina[2] | ||||||||
|---|---|---|---|---|---|---|---|---|
| Party | Candidate | Running mate | Popular vote | Electoral vote | ||||
| Count | % | Count | % | |||||
| Democratic | William Jennings Bryan of Nebraska | Arthur Sewall of Maine | 58,801 | 85.30% | 9 | 100.00% | ||
| Republican | William McKinley of Ohio | Garret Hobart of New Jersey | 9,313 | 13.51% | 0 | 0.00% | ||
| National Democratic | John McAuley Palmer of Illinois | Simon Bolivar Buckner of Kentucky | 824 | 1.20% | 0 | 0.00% | ||
| Total | 68,938 | 100.00% | 9 | 100.00% | ||||
Results by county
| County | William Jennings Bryan Democratic |
William McKinley Republican |
John McAuley Palmer National Democratic |
Margin | Total votes cast[3] | ||||
|---|---|---|---|---|---|---|---|---|---|
| # | % | # | % | # | % | # | % | ||
| Abbeville | 2,473 | 87.98% | 337 | 11.99% | 1 | 0.04% | 2,136 | 75.99% | 2,811 |
| Aiken | 1,819 | 92.48% | 137 | 6.96% | 11 | 0.56% | 1,682 | 85.51% | 1,967 |
| Anderson | 3,109 | 88.98% | 368 | 10.53% | 17 | 0.49% | 2,741 | 78.45% | 3,494 |
| Barnwell | 2,385 | 90.79% | 239 | 9.10% | 3 | 0.11% | 2,146 | 81.69% | 2,627 |
| Beaufort | 289 | 39.43% | 444 | 60.57% | 0 | 0.00% | -155 | -21.15% | 733 |
| Berkeley | 513 | 72.77% | 183 | 25.96% | 9 | 1.28% | 330 | 46.81% | 705 |
| Charleston | 1,660 | 47.82% | 1,262 | 36.36% | 549 | 15.82% | 398 | 11.47% | 3,471 |
| Chester | 1,254 | 93.58% | 76 | 5.67% | 10 | 0.75% | 1,178 | 87.91% | 1,340 |
| Chesterfield | 1,465 | 86.94% | 220 | 13.06% | 0 | 0.00% | 1,245 | 73.89% | 1,685 |
| Clarendon | 1,450 | 87.51% | 207 | 12.49% | 0 | 0.00% | 1,243 | 75.02% | 1,657 |
| Colleton | 1,646 | 82.51% | 343 | 17.19% | 6 | 0.30% | 1,303 | 65.31% | 1,995 |
| Darlington | 1,625 | 87.98% | 201 | 10.88% | 21 | 1.14% | 1,424 | 77.10% | 1,847 |
| Edgefield | 1,532 | 87.29% | 216 | 12.31% | 7 | 0.40% | 1,316 | 74.99% | 1,755 |
| Fairfield | 1,078 | 95.23% | 54 | 4.77% | 0 | 0.00% | 1,024 | 90.46% | 1,132 |
| Florence | 1,530 | 89.95% | 136 | 8.00% | 35 | 2.06% | 1,394 | 81.95% | 1,701 |
| Georgetown | 459 | 37.35% | 734 | 59.72% | 36 | 2.93% | -275 | -22.38% | 1,229 |
| Greenville | 2,718 | 89.38% | 288 | 9.47% | 35 | 1.15% | 2,430 | 79.91% | 3,041 |
| Hampton | 1,072 | 97.72% | 25 | 2.28% | 0 | 0.00% | 1,047 | 95.44% | 1,097 |
| Horry | 1,372 | 87.50% | 196 | 12.50% | 0 | 0.00% | 1,176 | 75.00% | 1,568 |
| Kershaw | 1,191 | 89.41% | 139 | 10.44% | 2 | 0.15% | 1,052 | 78.98% | 1,332 |
| Lancaster | 1,557 | 89.79% | 177 | 10.21% | 0 | 0.00% | 1,380 | 79.58% | 1,734 |
| Laurens | 1,943 | 94.60% | 111 | 5.40% | 0 | 0.00% | 1,832 | 89.19% | 2,054 |
| Lexington | 1,672 | 89.46% | 197 | 10.54% | 0 | 0.00% | 1,475 | 78.92% | 1,869 |
| Marion | 1,936 | 85.66% | 313 | 13.85% | 11 | 0.49% | 1,623 | 71.81% | 2,260 |
| Marlboro | 1,232 | 83.70% | 237 | 16.10% | 3 | 0.20% | 995 | 67.60% | 1,472 |
| Newberry | 1,525 | 95.43% | 64 | 4.01% | 9 | 0.56% | 1,461 | 91.43% | 1,598 |
| Oconee | 1,392 | 87.49% | 199 | 12.51% | 0 | 0.00% | 1,193 | 74.98% | 1,591 |
| Orangeburg | 2,729 | 90.63% | 282 | 9.37% | 0 | 0.00% | 2,447 | 81.27% | 3,011 |
| Pickens | 1,261 | 88.12% | 170 | 11.88% | 0 | 0.00% | 1,091 | 76.24% | 1,431 |
| Richland | 925 | 65.05% | 468 | 32.91% | 29 | 2.04% | 457 | 32.14% | 1,422 |
| Saluda | 1,241 | 95.39% | 60 | 4.61% | 0 | 0.00% | 1,181 | 90.78% | 1,301 |
| Spartanburg | 4,234 | 94.49% | 247 | 5.51% | 0 | 0.00% | 3,987 | 88.98% | 4,481 |
| Sumter | 1,550 | 81.58% | 326 | 17.16% | 24 | 1.26% | 1,224 | 64.42% | 1,900 |
| Union | 1,379 | 89.60% | 158 | 10.27% | 2 | 0.13% | 1,221 | 79.34% | 1,539 |
| Williamsburg | 1,570 | 81.73% | 347 | 18.06% | 4 | 0.21% | 1,223 | 63.66% | 1,921 |
| York | 2,013 | 92.81% | 152 | 7.01% | 4 | 0.18% | 1,861 | 85.80% | 2,169 |
| Totals | 58,799 | 87.70% | 9,313 | 13.51% | 824 | 1.23% | 49,486 | 71.78% | 68,940 |
See also
Notes
References
- ^ "1896 Presidential Election Statistics". Dave Leip’s Atlas of U.S. Presidential Elections. Retrieved March 5, 2018.
- ^ "1896 Presidential General Election Results - South Carolina". U.S. Election Atlas. Retrieved December 23, 2013.
- ^ Géoelections; Popular Vote at the Presidential Election for 1896 (.xlsx file for €30 including full minor party figures)