
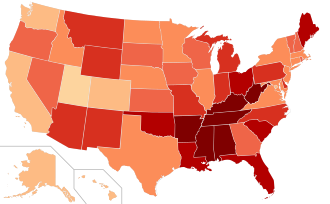
This article includes a list of U.S. states sorted by birth and death rate, expressed per 1,000 inhabitants, for 2021, using the most recent data available from the U.S. National Center for Health Statistics.
YouTube Encyclopedic
-
1/5Views:3401 325 579695 4512 799 0712 213 968
-
Top 20: US States and territories by life expectancy (1990 - 2017)
-
THE HISTORY OF THE UNITED STATES in 10 minutes
-
Top 10 Most Hated States in the US.
-
The Industrial Economy: Crash Course US History #23
-
How America became the No.1 Superpower? | Reality of USA | Dhruv Rathee
Transcription
2021 list

13+
12–12.9
11–11.9
10–10.9
9–9.9
8–8.9
13+
12–12.9
11–11.9
10–10.9
9–9.9
8–8.9
6–6.9
| 2021 rank |
State | Birth rate (per 1,000 people)[1] |
Death rate (per 1,000 people)[1] |
Rate of natural increase (per 1,000 people) |
|---|---|---|---|---|
| 1 | 15.5 | 7.6 | 7.9 | |
| 2 | - | - | - | |
| 3 | 14.0 | 6.8 | 7.2 | |
| 4 | 11.0 | 5.1 | 5.9 | |
| 5 | 12.8 | 8.5 | 4.3 | |
| 6 | 12.9 | 8.7 | 4.2 | |
| 7 | 13.0 | 9.4 | 3.6 | |
| 8 | 12.7 | 9.1 | 3.6 | |
| 9 | 12.5 | 9.6 | 2.9 | |
| 10 | 10.8 | 8.3 | 2.5 | |
| 11 | 12.7 | 10.3 | 2.4 | |
| 12 | 11.3 | 9.0 | 2.3 | |
| 13 | 10.7 | 8.5 | 2.2 | |
| 14 | 11.8 | 9.7 | 2.1 | |
| 15 | 11.0 | 9.1 | 1.9 | |
| 16 | 10.8 | 8.9 | 1.9 | |
| 17 | 10.8 | 8.9 | 1.9 | |
| 18 | 11.1 | 9.4 | 1.7 | |
| 19 | 10.6 | 9.1 | 1.5 | |
| 20 | 11.1 | 9.9 | 1.2 | |
| 21 | 11.5 | 10.4 | 1.1 | |
| 22 | 11.8 | 10.9 | 0.9 | |
| 23 | 9.9 | 9.0 | 0.9 | |
| 24 | 11.5 | 10.7 | 0.8 | |
| 25 | 10.4 | 9.9 | 0.5 | |
| 26 | 9.9 | 9.5 | 0.4 | |
| 27 | 11.7 | 11.5 | 0.2 | |
| 28 | 11.4 | 11.2 | 0.2 | |
| 29 | 10.7 | 10.5 | 0.2 | |
| 30 | 10.5 | 10.3 | 0.2 | |
| 31 | 12.4 | 12.4 | −0.0 | |
| 32 | 10.7 | 11.2 | −0.5 | |
| 33 | 10.8 | 11.4 | −0.6 | |
| 34 | 12.1 | 12.8 | −0.7 | |
| 35 | 11.3 | 12.0 | −0.7 | |
| 36 | 9.6 | 10.3 | −0.7 | |
| 37 | 10.4 | 11.3 | −0.9 | |
| 38 | 9.6 | 10.6 | −1.0 | |
| 39 | 9.1 | 10.2 | −1.1 | |
| 40 | 11.9 | 13.2 | −1.3 | |
| 41 | 10.4 | 11.7 | −1.3 | |
| 42 | 10.2 | 11.5 | −1.3 | |
| 43 | 11.7 | 13.1 | −1.4 | |
| 44 | 11.0 | 12.5 | −1.5 | |
| 45 | 11.0 | 12.6 | −1.6 | |
| 46 | 11.6 | 13.4 | −1.8 | |
| 47 | 10.2 | 12.0 | −1.8 | |
| 48 | 10.1 | 12.0 | −1.9 | |
| 49 | 11.9 | 13.9 | −2.0 | |
| 50 | 9.9 | 12.0 | −2.1 | |
| 51 | 11.5 | 13.7 | −2.2 | |
| 52 | 8.3 | 10.7 | −2.4 | |
| 53 | 8.7 | 12.6 | −3.9 | |
| 54 | 5.9 | 10.1 | −4.2 | |
| 55 | 9.6 | 16.5 | −6.9 | |
| — | 11.0 | 10.5 | 0.5 |
See also
References
- ^ a b "State and Territorial Data". National Center for Health Statistics. Retrieved 4 March 2023.