
In numerical analysis, multivariate interpolation is interpolation on functions of more than one variable (multivariate functions); when the variates are spatial coordinates, it is also known as spatial interpolation.
The function to be interpolated is known at given points and the interpolation problem consists of yielding values at arbitrary points .


Multivariate interpolation is particularly important in geostatistics, where it is used to create a digital elevation model from a set of points on the Earth's surface (for example, spot heights in a topographic survey or depths in a hydrographic survey).
YouTube Encyclopedic
-
1/3Views:3631 5512 360
-
Lecture 18 : Spatial Interpolation Techniques-01
-
Spatial Interpolation with GDAL in Python #2: IDW and Linear Interpolation
-
Spatial interpolation
Transcription
Regular grid
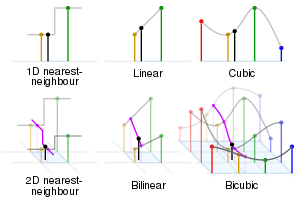
Black and red/yellow/green/blue dots correspond to the interpolated point and neighbouring samples, respectively.
Their heights above the ground correspond to their values.
For function values known on a regular grid (having predetermined, not necessarily uniform, spacing), the following methods are available.
Any dimension
- Nearest-neighbor interpolation
- n-linear interpolation (see bi- and trilinear interpolation and multilinear polynomial)
- n-cubic interpolation (see bi- and tricubic interpolation)
- Kriging
- Inverse distance weighting
- Natural neighbor interpolation
- Spline interpolation
- Radial basis function interpolation
2 dimensions
- Barnes interpolation
- Bilinear interpolation
- Bicubic interpolation
- Bézier surface
- Lanczos resampling
- Delaunay triangulation
Bitmap resampling is the application of 2D multivariate interpolation in image processing.
Three of the methods applied on the same dataset, from 25 values located at the black dots. The colours represent the interpolated values.
-
 Nearest neighbor
 -
 Bilinear
 -
 Bicubic


See also Padua points, for polynomial interpolation in two variables.
3 dimensions
See also bitmap resampling.
Tensor product splines for N dimensions
Catmull-Rom splines can be easily generalized to any number of dimensions. The cubic Hermite spline article will remind you that for some 4-vector which is a function of x alone, where is the value at of the function to be interpolated. Rewrite this approximation as


This formula can be directly generalized to N dimensions:[1]

Note that similar generalizations can be made for other types of spline interpolations, including Hermite splines. In regards to efficiency, the general formula can in fact be computed as a composition of successive -type operations for any type of tensor product splines, as explained in the tricubic interpolation article. However, the fact remains that if there are terms in the 1-dimensional -like summation, then there will be terms in the -dimensional summation.


Irregular grid (scattered data)
Schemes defined for scattered data on an irregular grid are more general. They should all work on a regular grid, typically reducing to another known method.
- Nearest-neighbor interpolation
- Triangulated irregular network-based natural neighbor
- Triangulated irregular network-based linear interpolation (a type of piecewise linear function)
- n-simplex (e.g. tetrahedron) interpolation (see barycentric coordinate system)
- Inverse distance weighting
- ABOS - approximation based on smoothing
- Kriging
- Gradient-enhanced kriging (GEK)
- Thin plate spline
- Polyharmonic spline (the thin-plate-spline is a special case of a polyharmonic spline)
- Radial basis function (Polyharmonic splines are a special case of radial basis functions with low degree polynomial terms)
- Least-squares spline
- Natural neighbour interpolation
Gridding is the process of converting irregularly spaced data to a regular grid (gridded data).
See also
Notes
External links
- Example C++ code for several 1D, 2D and 3D spline interpolations (including Catmull-Rom splines).
- Multi-dimensional Hermite Interpolation and Approximation, Prof. Chandrajit Bajaja, Purdue University
- Python library containing 3D and 4D spline interpolation methods.