
A sinus rhythm is any cardiac rhythm in which depolarisation of the cardiac muscle begins at the sinus node.[1] It is necessary, but not sufficient, for normal electrical activity within the heart.[2] On the electrocardiogram (ECG), a sinus rhythm is characterised by the presence of P waves that are normal in morphology.[2]
The term normal sinus rhythm (NSR) is sometimes used to denote a specific type of sinus rhythm where all other measurements on the ECG also fall within designated normal limits, giving rise to the characteristic appearance of the ECG when the electrical conduction system of the heart is functioning normally; however, other sinus rhythms can be entirely normal in particular patient groups and clinical contexts, so the term is sometimes considered a misnomer and its use is sometimes discouraged.[3][4]

Other types of sinus rhythm that can be normal include sinus tachycardia, sinus bradycardia, and sinus arrhythmia. Sinus rhythms may be present together with various other cardiac arrhythmias on the same ECG.
YouTube Encyclopedic
-
1/3Views:357 64663 9578 018
-
Normal sinus rhythm on an EKG | Circulatory System and Disease | NCLEX-RN | Khan Academy
-
The ECG Course - Sinus Rhythms
-
Normal Sinus Rhythm ECG - EMTprep.com
Transcription
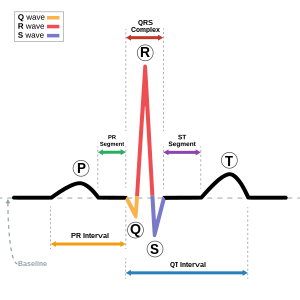
- [Voiceover] Let's look at a single heartbeat in EKG. So here on the right side we have a single beat on EKG. Now, we're looking at lead II. Lead II has a negative electrode on the right hand and a positive electrode on the left foot. In a healthy heart the wave of depolarization overall runs from the top right to the bottom left. So you can see that lead II measures voltage created in this direction. Therefore, lead II is commonly singled out for more simple information such as heart rate and rhythm because it gives you a pretty good view of the waves particularly the P wave. Often people say that lead II is the best lead to see the P wave. An EKG gives us information on voltage over time, or the change in voltage over time. So voltage is on the Y axis, time is on the X axis. Every small box running in the X axis or time direction represents 0.04 seconds. And there are one, two, three, four, five small boxes per every big box. So you can do the math, and you can calculate that each big box represents 0.2 seconds. Conduction starts with the heart's dominant pacemaker the SA node. The SA node initates waves of depolarization that run through the atria and go to the AV node. And on EKG this depolarization through the atria is seen as this purple wave here called the P wave. The P wave is usually about two small boxes or 0.08 seconds. Again, the P wave represents atrial depolarization. And what happens after the atria depolarizes? Well you get subsequent contraction. After the signal reaches the AV node conduction slows down. This is for a couple of reasons. One is that AV nodal cells are smaller in diameter than the other cells and as a rule the smaller the diameter of the cell the slower the conduction. In fact, AV nodal cells are among the smallest diameter cells in the body. Also, conduction runs primarily through calcium channels in the AV node. Calcium channels have inherently slow kinetics and this is in contrast to fast sodium channels that we see in the ventricular conduction system. This delay in conduction is really important because it allows time for the atria to contract and relax, which optimizes the time for the ventricles to fill. So, again we have the signal leaving the SA node going to the AV node where conduction slows down. This all happens before ventricular depolarization. On the EKG the time it takes from the beginning of atrial depolarization all the way up until ventricular depolarization is seen as the PR interval. The PR interval is typically 0.12 seconds, or three boxes. It shouldn't ever be longer than 0.2 seconds or something's wrong. The signal travels from the AV node to the His bundle. Once we hit the His bundle this is where conduction starts moving rather quickly. The His bundle bifurcates into the left and right bundle branches. And these branches branch into terminal Purkinje fibers. The depolarization from the His bundle down the bundle branches and to the Purkinje fibers leads to mass depolarization of ventricular cells, and is seen as the QRS complex on EKG. Again, the QRS complex represents ventricular depolarization. Like we said before, this is very rapid because we're using fast acting sodium channels now. So typically the QRS complex is about 0.12 seconds. It shouldn't be any longer than that. Early on depolarization the septum is depolarizing and the septum depolarizes from the left septum to the right septum. So you have the wave of depolarization going from the left septum to the right septum. You'll notice that this wave of depolarization moves in a different direction than lead II, which is why you get this first initial negative deflecting Q wave on EKG. However, quickly after the wave depolarization spreads throughout the ventricles, which is why you have the positive high amplitude R wave shortly after. Something else to note is that during ventricular depolarization you also have atrial repolarization. So, at the same time as the ventricles are depolarizing the atria are repolarizing. However, the EKG signal that you would see from atrial repolarization is actually lost because the QRS complex dominates since there are far more ventricular cells than there are atrial cells. So you don't see the atrial repolarization on EKG because it's buried in the QRS complex. So just after ventricular depolarization and in the initial phase of ventricular repolarization there's a flat segment on the EKG known as the ST segment. And the ST segment represents a period where there is no net current. That's to say there's no large electrical vectors in any direction. However, this doesn't mean there's not a lot going on. During the ST segment is when the ventricles are contracting and are pumping blood to the aorta and to the pulmonary artery. Finally, the ventricular cells repolarize and this is seen as the T wave on EKG. The T wave is flatter and longer than the QRS complex because repolarization is a slower process than depolarization. Again, this represents ventricular repolarization. The T wave typically takes up about four boxes or 0.16 seconds. Now something you might be asking yourself is why is the PR interval called the PR interval when it goes from the P to the Q wave? Well, remember we said that the PR interval is from the beginning of atrial depolarization up until the start of ventricular depolarization. Sometimes there's no Q wave on the EKG. It's just not found. So ventricular depolarization, or the start of it, is actually the start of the R wave, which is why it's called the PR interval. If there is a Q wave you can call it the PQ interval, however, to generalize we call it the PR interval for the times that the Q wave is lost. Something else you might be wondering is why is the T wave positive as well as the R wave. Why are the waves representing ventricular depolarization and ventricular repolarization in the same direction? And to answer this you need to remember two things. One is that the EKG gives you information on the difference in charge. So it gives you information on the changing imbalance of potential. The other thing to note is that the epicardial cells repolarize before the endocardial cells. What do I mean by that? Well, remember how we said that the wave of depolarization goes down the bundle of His, the right and left bundle branches and to the Purkinje fibers. So you can imagine that the cells on the inside or the endocardium depolarize first and the wave of depolarization spreads to the outside because we have the Purkinje fibers spreading the depolarization to the outer cells or the cells of the epicardium. Let's cut out this part of the heart so I can show you in more detail. Just remember the EKG sees cells at rest as being positive on the outside. The wave of depolarization comes down and depolarizes the cells in the endocardium first. So, those will be seen as negative while they're still positive on the outside because the depolarization hasn't gone through yet. Eventually, the endocardium and the epicardium will be depolarized and while typically cells that depolarize first repolarize first it's different in the heart ventricles. Epicardial cells actually repolarize before endocardial cells. So the EKG sees them as positive before endocardial cells are positive. You'll notice that during depolarization the vector created and during repolarization the vector created are both in the same direction, which is why the peak of the QRS complex and the T wave are in the same direction.
Characteristics
In humans, for an ECG to be described as showing a sinus rhythm, the shape of the P wave in each of the 12 standard ECG leads should be consistent with a "typical P vector" of +50° to +80°.[2] This means that the P wave should be:
- always positive in lead I, lead II, and aVF
- always negative in lead aVR
- any of biphasic (-/+), positive or negative in lead aVL
- positive in all chest leads, except for V1 which may be biphasic (+/-)[2]
If the P waves do not meet these criteria, they must be originating from an abnormal site elsewhere in the atria and not from the sinus node; the ECG cannot, therefore, be classed as showing a sinus rhythm.[2]
In general, each P wave in a sinus rhythm is followed by a QRS complex, and the sinus rhythm therefore gives rise to the whole heart's depolarization. Exceptions to this include complete heart block and certain ventricular artificial pacemaker rhythms, where the P waves may be completely normal in shape, but ventricular depolarization bears no relation to them; in these cases, the speed of the "sinus rhythm of the atria" and the speed of the ventricular rhythm must be calculated separately.[2]
Characteristics of normal sinus rhythm
By convention, the term "normal sinus rhythm" is taken to imply that not only are the P waves (reflecting activity of the sinus node itself) normal in morphology but that all other ECG measurements are also normal.[3][5] Criteria therefore include:
- Normal heart rate (classically 60 to 100 beats per minute for an adult).
- Regular rhythm, with less than 0.16-second variation in the shortest and longest durations between successive P waves
- The sinus node should pace the heart – therefore, P waves must be round, all the same shape, and present before every QRS complex in a ratio of 1:1.
- Normal P wave axis (0 to +75 degrees)
- Normal PR interval, QRS complex and QT interval.
- QRS complex positive in leads I, II, aVF and V3–V6, and negative in lead aVR.[3]
References
- ^ Hampton, John R (2013). The ECG Made Easy (8th ed.). Edinburgh: Churchill Livingstone. p. 4. ISBN 9780702046421.
- ^ a b c d e f Gertsch, Marc (2004). "3. The Normal ECG and its (Normal) Variants". The ECG: A Two-Step Approach to Diagnosis (1 ed.). Springer-Verlag Berlin Heidelberg. pp. 19–21. doi:10.1007/978-3-662-10315-9. ISBN 978-3-540-00869-9. OCLC 942900796.
- ^ a b c Conover, Boudreau Conover (2003). Understanding Electrocardiography (8th ed.). St Louis: Mosby. p. 46. ISBN 9780323019057.
- ^ Geiter, Henry B. (2006). E–Z ECG Rhythm Interpretation (1st ed.). Philadelphia: F.A. Davis. p. 106. ISBN 9780803620353.
- ^ Acar, RD; Bulut, M; Acar, Ş; Izci, S; Fidan, S; Yesin, M; Efe, SC (2015). "Evaluation of the P Wave Axis in Patients With Systemic Lupus Erythematosus". Journal of Cardiovascular and Thoracic Research. 7 (4): 154–57. doi:10.15171/jcvtr.2015.33. PMC 4685281. PMID 26702344.
External links
- "Normal Sinus Rhythm". Archived from the original on 15 December 2012.