
Real gross domestic product (real GDP) is a macroeconomic measure of the value of economic output adjusted for price changes (i.e. inflation or deflation).[1] This adjustment transforms the money-value measure, nominal GDP, into an index for quantity of total output. Although GDP is total output, it is primarily useful because it closely approximates the total spending: the sum of consumer spending, investment made by industry, excess of exports over imports, and government spending. Due to inflation, GDP increases and does not actually reflect the true growth in an economy. That is why the GDP must be divided by the inflation rate (raised to the power of units of time in which the rate is measured) to get the growth of the real GDP. Different organizations use different types of 'Real GDP' measures, for example, the UNCTAD uses 2015 Constant prices and exchange rates while the FRED uses 2009 constant prices and exchange rates, and recently the World Bank switched from 2005 to 2010 constant prices and exchange rates.[2][3][4]
| Economy | Top 10 countries by GDP in 2022 (millions in 2015 constant USD and exchange rates)
|
|---|---|
| (01) |
21,332,131
|
| (02) |
16,325,036
|
| (03) |
4,509,358
|
| (04) |
3,632,118
|
| (05) |
3,209,502
|
| (06) |
3,022,292
|
| (07) |
2,645,682
|
| (08) |
1,960,827
|
| (09) |
1,901,461
|
| (10) |
1,748,638
|
YouTube Encyclopedic
-
1/5Views:853 84579 60181 0221 166 81826 318
-
Real GDP and nominal GDP | GDP: Measuring national income | Macroeconomics | Khan Academy
-
How to Calculate Real GDP | Think Econ
-
Gross Domestic Product (GDP)
-
Nominal vs. Real GDP
-
Real vs Nominal GDP
Transcription
Let's say we're studying a very small and oversimplified country that only sells apples, and we measure the GDP in year one. And we measure that GDP as $1,000. And all of that is due to apples. And we also know that the price of apples in year one was $0.50 a pound. So I'll write it as $0.50 per pound. And let's say that now year one has gone by and even year two has gone by, and we're able to measure the GDP in year two. So the GDP in year two is $1,200. And the price of apples in year two, let's just say it is $0.55 a pound. So my question to you is, GDP, the whole point of measuring GDP, is measuring the productivity of a country. I mean we are measuring in terms of dollars, but we care more about just the dollar amount. We really care is, was this country more productive? And if it was more productive, how much more productive was it? And if we just look at these GDP numbers right over here, this $1,000 versus this $1,200, it gives you the sense that-- well, at least if you just look at the numbers-- $1,200 is 20% larger than $1,000. So if you just look at those numbers right over there, it looks like the GDP grew by 20%. But is that an accurate representation of the productivity of this country? Did it actually produce 20% more goods? And a big clue is looking at this price here. Because some of this GDP actually might have increased just due to price. But that doesn't actually make the country more productive. The quantity, the extra quantity of apples that the country produces, is actually what adds to the total productivity. One way to think about it-- Let me draw a little diagram over here. On this axis, I'll do quantity. On this axis, I will do price. And P1, so if I want to figure out the GDP in year one, I would have the price of apples in year one-- that's the only good or service, just to simplify things-- times the quantity of apples in year one. And then this right over here, the area of this green rectangle, would GDP in year one. And then GDP in year two would be the price in year two. So we're going to go from $0.50 to $0.55. The price in year two times the quantity in year two-- we'll assume some growth as occurred-- times the quantity in year two. And so GDP in year two would be the area of this entire rectangle. And if we want to find the difference between GDP in year two and GDP in year one, it would be the difference in area. So it would be what I am shading in, in blue right over here. And based on the numbers that we went over right over here, the area that I'm shading in, in blue-- so the difference between GDP in year two and GDP in year one, the area I'm shading in blue-- would be this 200, the 200 increment. So this area right over here would be that 200. Now when you look at it over here, you see that that 200, some of it is due to an increase in quantity. But a lot of it is also due to an increase in price. So if we really wanted to figure out how much more productive the country got, and we still want to measure GDP in dollars, maybe we can take a measure of GDP that measures year two's GDP, but it does it in year one's prices. So if we could somehow multiply-- if we could multiply year two's quantity by year one's prices, then we would get this rectangle right over here. And then the difference between that and year one, would give us the incremental GDP in year one prices due to quantity. And that's what we care about. We care about total productivity. When we're thinking about GDP one, we say how much more productive did the country get? So let's try to do it with these numbers right over here. So we can figure out quantity two, we could figure out the quantity in year two just by dividing the GDP by the price. Just by dividing this area of the entire blue rectangle and dividing it by the price, that will give us the quantity. So if we divide 1,200 divided by $0.55-- let me get my calculator out. So if I do 1,200 divided by $0.55, this is my quantity of apples and in pounds in year two. And I'll just round it, 2,182. So this is 2,182. So the quantity in year two is 2,182 pounds. So this is equal to that. And then I could multiply this times the price. So this is this quantity. It's 2,182 pounds. And then I could multiply it times the price in year one at year one's price. So I'm going to multiply it times-- P1 is equal to $0.50 a pound, $0.50 per pound. And this will give me-- so let me just get my calculator out. I should be able to do that one in my head. But let's see 0.5. And I get 1,090. Obviously, I'll round it to 1,091. So this is equal to 1,091. And this is an interesting number. So this is-- you could view this as year two's GDP. In year-- or adjusted for-- I'll write it, adjusted for prices, or adjusted for price increases. Or you could say in year one prices. And what's useful about this is, this says, look, if prices had remained constant, this is what our GDP would have gotten to. If prices did not increase, our GDP would have gotten to this 1,091. 1,091 is this area that I drew in pink here. And so now, you could say if prices were held constant, the growth in GDP would have been $91 not $200. So this area right over here that I'm-- actually, let me do it in a color. Let me do it in orange, maybe. This area right over here, the actual growth, if prices were held constant, would have been $91. We would have gone from $1,000 of GDP to $1,091. So this right over here, that area, is $91 of-- and we could even call it real growth. It really measures the productivity. Now this gives us an interesting, I guess, set of ideas. One idea is to just measure your GDP in the current year's dollars. So this was GDP measured in year two's dollars. It was year two GDP measured in year two dollars, year two prices. So we could call that year two's nominal GDP. Nominal, in name. So it's GDP in name, in that year's prices. But this right over here, where we measured year two's GDP, in some base year's prices-- so it allows a real comparison of how much did our productivity actually increase. Our productivity actually increased by 9%. We produced 9% more apples. This, we call real GDP. Because it gives you a measure of real productivity. It tries to take out price increases. What we'll see in the future, or we might not do it in an introductory course, but in practice, it's kind of hard to really measure what the absolute-- this was a simple economy, where we only had one product. But if you have many, many, many products-- actually gazillions of products in a real economy and the prices are adjusting and the quantities are adjusting, it's not so easy to figure out how to adjust for price. But the folks running the national income accounts do try to do this. So they get a sense of how much was the actual real growth.
Economic sectors of nations using real GDP
-
 20 largest economies by industrial output at 2015 constant prices.
 -
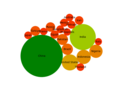 20 largest economies by agricultural output at 2015 constant prices.
 -
 20 largest economies by tertiary output at 2015 constant prices.


| Economy | Top 20 countries by industrial output in 2022 (millions in 2015 constant USD and exchange rates)
|
|---|---|
| (01) |
6,540,214
|
| (02) |
3,686,544
|
| (03) |
1,356,612
|
| (04) |
961,588
|
| (05) |
802,990
|
| (06) |
586,416
|
| (07) |
532,905
|
| (08) |
448,254
|
| (09) |
433,008
|
| (10) |
424,380
|
| (11) |
422,737
|
| (12) |
403,049
|
| (13) |
381,446
|
| (14) |
342,712
|
| (15) |
317,749
|
| (16) |
303,743
|
| (17) |
295,018
|
| (18) |
271,053
|
| (19) |
248,046
|
| Economy | Countries by agricultural output in 2022 (millions in 2015 constant USD and exchange rates)
|
|---|---|
| (01) |
1,278,267
|
| (02) |
480,031
|
| (03) |
181,387
|
| (04) |
142,369
|
| (05) |
122,120
|
| Economy | Countries by tertiary (services) output in 2022 (millions in 2015 constant USD and exchange rates)
|
|---|---|
| (01) |
17,586,587
|
| (02) |
8,606,499
|
| (03) |
3,075,930
|
| (04) |
2,319,760
|
| (05) |
2,275,222
|
Relationship with nominal GDP
Real GDP is an example of the distinction between real and nominal values in economics. Nominal gross domestic product is defined as the market value of all final goods produced in a geographical region, usually a country; this depends on the quantities of goods and services produced, and their respective prices.
If a set of real GDPs from various years are calculated, each using the quantities from its own year, but all using the prices from the same base year, the differences in those real GDPs will reflect only differences in volume.
An index called the GDP deflator can be obtained by dividing, for each year, the nominal GDP by the real GDP, so that the GDP deflator for the base year will be 100. It gives an indication of the overall level of price change (inflation or deflation) in the economy.
- GDP deflator for year

Real GDP growth on an annual basis is the nominal GDP growth rate adjusted for inflation. It is usually expressed as a percentage.
"GDP" may refer to "nominal" or "current" or "historical" GDP, to distinguish it from real GDP. Real GDP is sometimes called "constant" GDP because it is expressed in terms of constant prices. Depending on context, "GDP" may also refer to real GDP.
Notes and references
- ^ Kenton, Will. "Real Gross Domestic Product (GDP)". Investopedia.com. Retrieved 2 April 2019.
- ^ U.S. Bureau of Economic Analysis (1 January 1947). "Real Gross Domestic Product". FRED, Federal Reserve Bank of St. Louis. Retrieved 2 April 2019.
- ^ a b c d e "UNCTADstat - Table view". Unctadstat.unctad.org. Retrieved 20 February 2024.
- ^ "GDP (constant 2010 US$) - Data". Data.worldbank.org. Retrieved 2 April 2019.
List of countries by real GDP growth rate
External links
- Google - public data: GDP and Personal Income of the U.S. (annual): Quantity Index for Real GDP
- Google - public data: GDP and Personal Income of the U.S. (annual): Real Gross Domestic Product
- Google - public data: GDP and Personal Income of the U.S. (annual): Real Gross Domestic Product per capita