


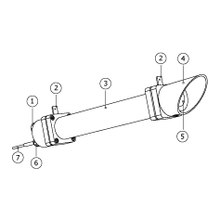
A pyrheliometer is an instrument that can measure direct beam solar irradiance.[1] Sunlight enters the instrument through a window and is directed onto a thermopile which converts heat to an electrical signal that can be recorded. The signal voltage is converted via a formula to measure watts per square metre.
YouTube Encyclopedic
-
1/3Views:4 5972 12019 212
-
Pyranometer - Tech Tips with Vernier
-
SP C L12 Solar Radiation Measurement
-
Lecture 43 (2014) Solar radiation 5 of 7
Transcription
Measure. Analyze. Learn. This is the Vernier Pyranometer. It's designed to measure total solar radiation. So, what you're doing is measuring the illumination as a function of watts per square meter. So, the obvious usage with this would be with a solar panel experiment; maybe you're looking at the power output as a function of angle, or different kinds of solar panels. Things like that. For this experiment, what I've done is, I've already hooked up a Vernier High Current Sensor, and a Vernier 30-Volt Voltage Probe to the setup here. And, I'm going to measure the power output of this set up, over a function of time, so I'm actually going to let it run for a couple of hours And then, we'll take a look at some data here. Now, the pyranometer. There's a couple things about it: the actual sensitive part is under this little dome right here. And so, this needs to be mounted vertically, with the cord facing north if you're in the northern hemisphere, or south if your in the southern hemisphere, with this aimed straight up. It's got an angular compensation for it, so as the sun crosses the sky, it can measure that. It's intended to be straight up. Now, its the case is actually weather-proof, so you can leave it outside, and it comes with a six meter long cord for that. So, the idea is that you might mount it on the roof, and then have this piece of the electronics inside, to be able to monitor the solar radiation. For mounting, there's actually a screw here. And so, you could take it out, and attach it to something, and be able to screw it on to there. So, to collect data with these three devices, what I will do is plug them all into the LabQuest 2. And so, if I plug in, say, the voltage probe, and then I plug in the current probe, and then, the pyranometer, I will have all three devices running at once on the LabQuest. So, we've got all our sensors plugged in here, and one of the things I would like to do to make this easier to see outdoors is to change my LabQuest 2, to a high contrast mode. And to do this, I go under the little house icon there, go to "Preferences" - "Light & Power" - and down in the lower left hand corner I can check "High Contrast" and then it will be easier to see out here in the sunshine. Now that we set the screen to high contrast; you see our three sensors there; you might want to take a look at our default collection parameters. The "Mode" is time based, so it is going to be looking at these different variables as a function of time. The sample "Rate" is .017 samples per second; that's actually once every minute. And the "Duration" is 86,400 seconds; that's actually a 24 hour collection. So, it's designed to track solar radiation throughout an entire 24 hour period. So, now we have all our sensors plugged in, and our pyranometer in place, we'd be ready to collect data. And so, if I collect data, it's going to start collection, and it would collect data for 24 hours, or in this case, maybe until the battery ran out, because I'm not plugged in. And so, it's going to be able to do that. Now, I'm actually not going to let it run and collect the data here. I'm going to share with you some data that I've collected previously, to be able to show you what the data might look like. I'm going to go "File" - "Open", and I already have some pyranometer data, so I'm going to open it up instead. And, we'll take a look at that. We can "Discard" whatever we collected this time. So, I've got the same sensors for this experiment. But, I want to go over here and actually look at a graph. And, what I have here is kind of interesting. The upper graph, is the graph of irradiance in watts per square meter. So, we see it, and I started kind of mid day, and had it collect over a period of time, and then it went down. The interesting part is here, this is where the sun went behind some trees late in the day. And, of course, the irradiance dropped there down. This column, or this graph here, is actually a calculated column with "(watts)". We were collecting with the current sensor and the voltage probe, and I had it calculate the power output. So, it had the product of the current and the voltage together. And, that's actually what is being displayed here. And so, we're seeing the relationship between the irradiance and the power output in watts, down here. To see that in the column, if I go over to the data table here, we can see that I have that. And, the "(watts)" column here, if I click on it; we can see that it actually, I named it "power"; the units of "watts"; the equation I put in there was "XY"; and I set "X" to be "Current"; and the "Potential" to be "Y"; and it calculated that, and that's what I showed on the graph. Now, if we go back to here, you see that there's a little drop in the data at one point. I don't know exactly what happened, because I wasn't there. I suspect, that maybe, that was a cloud passing, and it just happened to be at the time that I was collecting data. The data, the day I collected this was very sunny, but there were the occasional high clouds passing by, and so that it dropped down there. So, the pyranometer is a /makes an excellent addition to the study of alternative energy, maybe with a solar panel. And so, it can be mounted long term, so long term data collection. So, it's a really nice device for those kinds of experiments.
Standards
Pyrheliometer measurement specifications are subject to International Organization for Standardization (ISO) and World Meteorological Organization (WMO) standards. Comparisons between pyrheliometers for intercalibration are carried out regularly to measure the amount of solar energy received. The aim of the International Pyrheliometer Comparisons,[2] which take place every 5 years at the World Radiation Centre[3] in Davos, is to ensure the world-wide transfer of the World Radiometric Reference. During this event, all participants bring their instruments, solar-tracking and data acquisition systems to Davos to conduct simultaneous solar radiation measurements with the World Standard Group.[4]
Applications
Typical pyrheliometer measurement applications include scientific meteorological and climate observations, material testing research, and assessment of the efficiency of solar collectors and photovoltaic devices.
Usage
Pyrheliometers are typically mounted on a solar tracker. As the pyrheliometer only 'sees' the solar disk, it needs to be placed on a device that follows the path of the sun.
See also
References
- ^ "Pyrheliometer". kippzonen.com. Archived from the original on April 12, 2009.
- ^ "welcome to pmodwrc". April 16, 2010. Archived from the original on 2010-04-16.
- ^ "welcome to pmodwrc". July 2, 2007. Archived from the original on 2007-07-02.
- ^ "Startseite". PMOD/WRC.
External links
 Media related to Pyrheliometer at Wikimedia Commons