
Manaung
မာန်အောင် | |
|---|---|
Town | |
 | |
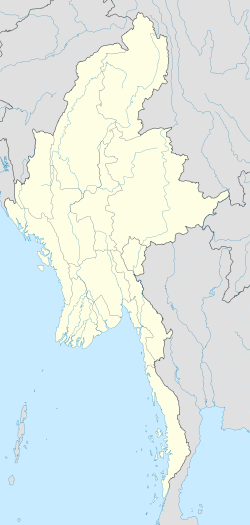 Manaung Location in Myanmar (Burma) | |
| Coordinates: 18°51′N 93°44′E / 18.850°N 93.733°E | |
| Country | |
| Division | |
| District | Kyaukpyu District |
| Township | Manaung Township |
| Population (2005) | |
| • Religions | Buddhism |
| Time zone | UTC+6.30 (MST) |
Manaung (Burmese: မာန်အောင်မြို့) is a town in Rakhine State, Myanmar (Burma) on Cheduba Island. It lies on the left bank of a river in the north-east of the island. The town is served by Manaung Airport.
YouTube Encyclopedic
-
1/3Views:51032 93616 811
-
Manaung Youth Networking Group 2014 မာန္ေအာင္လူငယ္ကြန္ယက္
-
Literature Talk Show (Man Aung, Rakhine) Sayar Annawa Soe Moe
-
Literature Talk Show (Thit Pone, Man Aung Tsp, Rakhine) Sayar Annawa Soe Moe
Transcription
Climate
| Climate data for Manaung (1991–2020) | |||||||||||||
|---|---|---|---|---|---|---|---|---|---|---|---|---|---|
| Month | Jan | Feb | Mar | Apr | May | Jun | Jul | Aug | Sep | Oct | Nov | Dec | Year |
| Mean daily maximum °C (°F) | 29.5 (85.1) |
30.3 (86.5) |
32.2 (90.0) |
34.1 (93.4) |
33.6 (92.5) |
30.7 (87.3) |
30.0 (86.0) |
29.9 (85.8) |
31.0 (87.8) |
32.1 (89.8) |
31.9 (89.4) |
30.3 (86.5) |
31.3 (88.3) |
| Daily mean °C (°F) | 21.7 (71.1) |
22.2 (72.0) |
25.2 (77.4) |
27.9 (82.2) |
28.5 (83.3) |
27.1 (80.8) |
26.5 (79.7) |
27.1 (80.8) |
27.3 (81.1) |
27.7 (81.9) |
27.0 (80.6) |
22.1 (71.8) |
25.9 (78.6) |
| Mean daily minimum °C (°F) | 14.0 (57.2) |
14.0 (57.2) |
18.2 (64.8) |
21.7 (71.1) |
23.4 (74.1) |
23.6 (74.5) |
23.1 (73.6) |
24.3 (75.7) |
23.7 (74.7) |
23.2 (73.8) |
22.1 (71.8) |
13.9 (57.0) |
20.4 (68.7) |
| Average precipitation mm (inches) | 9.0 (0.35) |
1.5 (0.06) |
2.7 (0.11) |
18.0 (0.71) |
248.6 (9.79) |
829.9 (32.67) |
1,020.1 (40.16) |
870.8 (34.28) |
517.1 (20.36) |
250.6 (9.87) |
46.4 (1.83) |
7.9 (0.31) |
3,822.5 (150.49) |
| Average precipitation days (≥ 1.0 mm) | 0.4 | 0.2 | 0.3 | 1.0 | 9.6 | 19.7 | 23.1 | 22.6 | 18.0 | 11.3 | 2.4 | 0.6 | 109.0 |
| Source: World Meteorological Organization[1] | |||||||||||||
References
- ^ "World Meteorological Organization Climate Normals for 1991–2020". World Meteorological Organization. Retrieved 16 October 2023.
External links
Capital: Sittwe | ||
| Kyaukpyu District |   | |
| Maungdaw District | ||
| Sittwe District | ||
| Thandwe District | ||
| Mrauk-U District | ||
| Main cities and towns | ||
This Myanmar location article is a stub. You can help Wikipedia by expanding it. |