
The official statistics of Germany, available on the Destatis website, do not include total life expectancy for the population as a whole. For a more correct comparison of regions with various differences in life expectancy for men and women, a column with the arithmetic mean of these indicators was added to the tables.
YouTube Encyclopedic
-
1/5Views:919 2325 949 4438 015 3894998 966 725
-
All 50 Countries in EUROPE Ranked WORST to BEST
-
All 50 STATES in AMERICA Ranked WORST to BEST
-
Top 20 Country GDP (PPP) History & Projection (1800-2040)
-
Indonesian Provinces vs Indian States, Compared by Average Life Expectancy at Birth, 1990-2022
-
Hitler's Plans for the World if He Won
Transcription
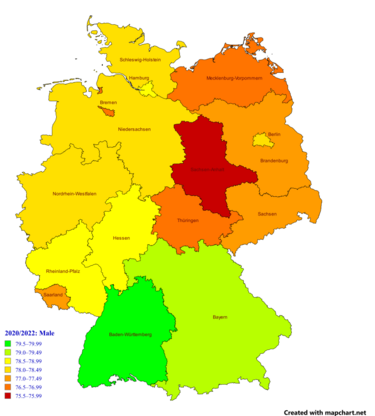
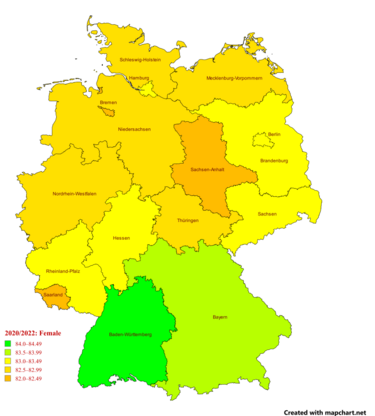
Destatis (2020/2022)
| state | male | female | sex gap | arith. mean |
|---|---|---|---|---|
| Germany on average | 78.33 | 83.18 | 4.85 | 80.76 |
| Baden-Württemberg | 79.72 | 84.11 | 4.39 | 81.91 |
| Bavaria | 79.11 | 83.64 | 4.53 | 81.38 |
| Hesse | 78.87 | 83.33 | 4.46 | 81.10 |
| Hamburg | 78.57 | 83.23 | 4.66 | 80.90 |
| Rhineland-Palatinate | 78.54 | 83.01 | 4.47 | 80.78 |
| Berlin | 78.11 | 83.29 | 5.18 | 80.70 |
| Schleswig-Holstein | 78.41 | 82.91 | 4.50 | 80.66 |
| Lower Saxony | 78.05 | 82.93 | 4.88 | 80.49 |
| North Rhine-Westphalia | 78.10 | 82.66 | 4.56 | 80.38 |
| Saxony | 77.27 | 83.49 | 6.22 | 80.38 |
| Brandenburg | 77.24 | 83.19 | 5.95 | 80.22 |
| Thuringia | 76.94 | 82.72 | 5.78 | 79.83 |
| Mecklenburg-Vorpommern | 76.68 | 82.79 | 6.11 | 79.74 |
| Saarland | 77.22 | 82.06 | 4.84 | 79.64 |
| Bremen | 76.93 | 82.30 | 5.37 | 79.62 |
| Saxony-Anhalt | 75.78 | 82.28 | 6.50 | 79.03 |
Data source: Destatis[1][2][3]
Destatis (2016/2018)
This is a list of German states by life expectancy at birth (average of 2016 to 2018) according to the Federal Statistical Office of Germany.[4]
| Rank | State | Life expectancy in years (mean of both) |
Life expectancy in years (men) |
Life expectancy in years (women) |
|---|---|---|---|---|
| 1 | 81.88 | 79.66 | 84.10 | |
| 2 | 81.56 | 79.33 | 83.56 | |
| 3 | 81.32 | 79.15 | 83.48 | |
| 4 | 80.95 | 78.53 | 83.37 | |
| 5 | 80.94 | 77.97 | 83.91 | |
| 6 | 80.84 | 78.62 | 83.06 | |
| 7 | 80.75 | 78.30 | 83.19 | |
| 8 | 80.51 | 77.76 | 83.26 | |
| 9 | 80.48 | 78.18 | 82.78 | |
| 10 | 80.47 | 78.11 | 82.82 | |
| 10 | 80.47 | 78.17 | 82.76 | |
| 12 | 80.23 | 77.44 | 83.02 | |
| 13 | 79.95 | 76.76 | 83.14 | |
| 14 | 79.88 | 77.62 | 82.14 | |
| 15 | 79.83 | 77.18 | 82.47 | |
| 16 | 79.46 | 76.28 | 82.63 | |
| 80.88 | 78.48 | 83.27 |
Eurostat (2019—2022)
By default the table is sorted by 2022.
| code | region | 2019 | 2019 →2021 |
2021 | 2021 →2022 |
2022 | 2019 →2022 | ||||||
|---|---|---|---|---|---|---|---|---|---|---|---|---|---|
| overall | male | female | F Δ M | overall | overall | male | female | F Δ M | |||||
| DE21 | Upper Bavaria | 82.8 | 80.9 | 84.7 | 3.8 | −0.4 | 82.4 | −0.1 | 82.3 | 80.2 | 84.4 | 4.2 | −0.5 |
| DE14 | Tübingen | 82.4 | 80.3 | 84.6 | 4.3 | 0.0 | 82.4 | −0.3 | 82.1 | 80.0 | 84.2 | 4.2 | −0.3 |
| DE11 | Stuttgart | 82.6 | 80.4 | 84.7 | 4.3 | −0.3 | 82.3 | −0.3 | 82.0 | 79.9 | 84.0 | 4.1 | −0.6 |
| DE13 | Freiburg | 82.3 | 80.2 | 84.4 | 4.2 | −0.2 | 82.1 | −0.1 | 82.0 | 79.8 | 84.1 | 4.3 | −0.3 |
| DE12 | Karlsruhe | 81.8 | 79.6 | 84.0 | 4.4 | −0.1 | 81.7 | −0.1 | 81.6 | 79.5 | 83.7 | 4.2 | −0.2 |
| DE27 | Swabia | 82.1 | 80.0 | 84.2 | 4.2 | −0.5 | 81.6 | −0.1 | 81.5 | 79.4 | 83.7 | 4.3 | −0.6 |
| DED2 | Dresden | 81.9 | 79.1 | 84.8 | 5.7 | −1.4 | 80.5 | 1.0 | 81.5 | 78.6 | 84.5 | 5.9 | −0.4 |
| DE26 | Lower Franconia | 82.1 | 80.0 | 84.3 | 4.3 | −0.5 | 81.6 | −0.2 | 81.4 | 79.2 | 83.6 | 4.4 | −0.7 |
| DE71 | Darmstadt | 82.1 | 80.1 | 84.0 | 3.9 | −0.5 | 81.6 | −0.3 | 81.3 | 79.3 | 83.3 | 4.0 | −0.8 |
| DEA2 | Cologne | 81.3 | 79.2 | 83.4 | 4.2 | −0.1 | 81.2 | −0.3 | 80.9 | 78.7 | 83.0 | 4.3 | −0.4 |
| DE22 | Lower Bavaria | 81.4 | 79.4 | 83.5 | 4.1 | −0.8 | 80.6 | 0.3 | 80.9 | 78.5 | 83.3 | 4.8 | −0.5 |
| DE30 | Berlin | 81.5 | 79.1 | 83.9 | 4.8 | −0.5 | 81.0 | −0.1 | 80.9 | 78.3 | 83.4 | 5.1 | −0.6 |
| DEB3 | Rheinhessen-Pfalz | 81.3 | 79.2 | 83.4 | 4.2 | −0.2 | 81.1 | −0.3 | 80.8 | 78.6 | 82.9 | 4.3 | −0.5 |
| DE60 | Hamburg | 81.5 | 79.2 | 83.8 | 4.6 | −0.4 | 81.1 | −0.3 | 80.8 | 78.5 | 83.1 | 4.6 | −0.7 |
| DE25 | Middle Franconia | 81.3 | 79.0 | 83.4 | 4.4 | −0.6 | 80.7 | 0.1 | 80.8 | 78.5 | 83.0 | 4.5 | −0.5 |
| DEB2 | Trier | 81.7 | 79.6 | 83.7 | 4.1 | −0.1 | 81.6 | −1.0 | 80.6 | 78.4 | 82.9 | 4.5 | −1.1 |
| DEA4 | Detmold | 81.6 | 79.2 | 83.9 | 4.7 | −0.3 | 81.3 | −0.7 | 80.6 | 78.3 | 83.0 | 4.7 | −1.0 |
| DED5 | Leipzig | 81.0 | 78.1 | 84.0 | 5.9 | −0.7 | 80.3 | 0.3 | 80.6 | 77.6 | 83.7 | 6.1 | −0.4 |
| DE23 | Upper Palatinate | 81.3 | 79.1 | 83.4 | 4.3 | −0.7 | 80.6 | −0.1 | 80.5 | 78.2 | 82.8 | 4.6 | −0.8 |
| DE73 | Kassel | 81.3 | 79.0 | 83.6 | 4.6 | −0.7 | 80.6 | −0.2 | 80.4 | 78.2 | 82.7 | 4.5 | −0.9 |
| DEF0 | Schleswig-Holstein | 80.9 | 78.6 | 83.3 | 4.7 | 0.1 | 81.0 | −0.6 | 80.4 | 78.2 | 82.5 | 4.3 | −0.5 |
| DEB1 | Koblenz | 81.1 | 79.0 | 83.1 | 4.1 | −0.5 | 80.6 | −0.3 | 80.3 | 78.2 | 82.5 | 4.3 | −0.8 |
| DE72 | Giessen | 81.0 | 78.8 | 83.2 | 4.4 | −0.4 | 80.6 | −0.3 | 80.3 | 78.0 | 82.7 | 4.7 | −0.7 |
| DE94 | Weser-Ems | 81.0 | 78.6 | 83.4 | 4.8 | −0.1 | 80.9 | −0.6 | 80.3 | 78.0 | 82.7 | 4.7 | −0.7 |
| DE40 | Brandenburg | 81.2 | 78.4 | 84.0 | 5.6 | −1.2 | 80.0 | 0.3 | 80.3 | 77.4 | 83.2 | 5.8 | −0.9 |
| DED4 | Chemnitz | 80.8 | 77.8 | 83.9 | 6.1 | −1.8 | 79.0 | 1.3 | 80.3 | 77.3 | 83.3 | 6.0 | −0.5 |
| DE93 | Lüneburg | 80.9 | 78.5 | 83.2 | 4.7 | −0.2 | 80.7 | −0.5 | 80.2 | 78.0 | 82.5 | 4.5 | −0.7 |
| DEA3 | Münster | 81.1 | 78.7 | 83.4 | 4.7 | −0.6 | 80.5 | −0.3 | 80.2 | 78.0 | 82.4 | 4.4 | −0.9 |
| DE92 | Hanover | 81.0 | 78.4 | 83.5 | 5.1 | −0.3 | 80.7 | −0.6 | 80.1 | 77.7 | 82.7 | 5.0 | −0.9 |
| DE91 | Braunschweig | 80.6 | 78.4 | 82.9 | 4.5 | −0.2 | 80.4 | −0.4 | 80.0 | 77.7 | 82.3 | 4.6 | −0.6 |
| DE24 | Upper Franconia | 81.2 | 78.7 | 83.6 | 4.9 | −0.9 | 80.3 | −0.3 | 80.0 | 77.4 | 82.6 | 5.2 | −1.2 |
| DEA1 | Düsseldorf | 80.7 | 78.4 | 82.9 | 4.5 | −0.3 | 80.4 | −0.5 | 79.9 | 77.6 | 82.1 | 4.5 | −0.8 |
| DEG0 | Thuringia | 80.7 | 78.0 | 83.5 | 5.5 | −1.6 | 79.1 | 0.7 | 79.8 | 77.0 | 82.6 | 5.6 | −0.9 |
| DEA5 | Arnsberg | 80.4 | 78.0 | 82.7 | 4.7 | −0.5 | 79.9 | −0.2 | 79.7 | 77.4 | 81.9 | 4.5 | −0.7 |
| DE80 | Mecklenburg-Vorpommern | 80.3 | 77.3 | 83.5 | 6.2 | −0.6 | 79.7 | −0.1 | 79.6 | 76.6 | 82.7 | 6.1 | −0.7 |
| DEC0 | Saarland | 80.2 | 77.9 | 82.5 | 4.6 | −0.4 | 79.8 | −0.6 | 79.2 | 76.8 | 81.8 | 5.0 | −1.0 |
| DE50 | Bremen | 80.7 | 78.0 | 83.3 | 5.3 | −0.5 | 80.2 | −1.0 | 79.2 | 76.6 | 81.8 | 5.2 | −1.5 |
| DEE0 | Saxony-Anhalt | 80.0 | 77.0 | 83.1 | 6.1 | −1.4 | 78.6 | 0.2 | 78.8 | 75.7 | 82.1 | 6.4 | −1.2 |
![Life expectancy in German regions in comparison with regions of other European countries in 2019 and 2022, according to Eurostat[5][6](legends on the maps are identical)](http://upload.wikimedia.org/wikipedia/commons/thumb/2/21/Life_expectancy_in_European_regions_by_Eutostat_-2019.png/492px-Life_expectancy_in_European_regions_by_Eutostat_-2019.png)
![Life expectancy in German regions in comparison with regions of other European countries in 2019 and 2022, according to Eurostat[5][6](legends on the maps are identical)](http://upload.wikimedia.org/wikipedia/commons/thumb/6/69/Life_expectancy_in_European_regions_by_Eutostat_-2022.png/492px-Life_expectancy_in_European_regions_by_Eutostat_-2022.png)
Charts
-
![Development of life expectancy in Germany according to estimation of the World Bank Group[7]](//upload.wikimedia.org/wikipedia/commons/thumb/b/bc/Life_expectancy_by_WBG_-Germany.png/431px-Life_expectancy_by_WBG_-Germany.png) Development of life expectancy in Germany according to estimation of the World Bank Group[7]
Development of life expectancy in Germany according to estimation of the World Bank Group[7] -
![Life expectancy with calculated sex gap[7]](//upload.wikimedia.org/wikipedia/commons/thumb/b/bc/Life_expectancy_by_WBG_-Germany_-diff.png/360px-Life_expectancy_by_WBG_-Germany_-diff.png) Life expectancy with calculated sex gap[7]
Life expectancy with calculated sex gap[7] -
![Life expectancy in Germany according to estimation of Our World in Data[8]](//upload.wikimedia.org/wikipedia/commons/thumb/4/44/Life_expectancy_in_Germany.svg/319px-Life_expectancy_in_Germany.svg.png) Life expectancy in Germany according to estimation of Our World in Data[8]
Life expectancy in Germany according to estimation of Our World in Data[8] -
![Development of life expectancy in Germany in comparison to some big countries of the world[7]](//upload.wikimedia.org/wikipedia/commons/thumb/f/f5/Life_expectancy_in_some_big_countries.png/355px-Life_expectancy_in_some_big_countries.png) Development of life expectancy in Germany in comparison to some big countries of the world[7]
Development of life expectancy in Germany in comparison to some big countries of the world[7] -
![Development of life expectancy in Germany in comparison to the largest by population European countries[7]](//upload.wikimedia.org/wikipedia/commons/thumb/2/24/Life_expectancy_in_the_largest_European_countries.png/355px-Life_expectancy_in_the_largest_European_countries.png) Development of life expectancy in Germany in comparison to the largest by population European countries[7]
Development of life expectancy in Germany in comparison to the largest by population European countries[7]
![Development of life expectancy in Germany according to estimation of the World Bank Group[7]](http://upload.wikimedia.org/wikipedia/commons/thumb/b/bc/Life_expectancy_by_WBG_-Germany.png/431px-Life_expectancy_by_WBG_-Germany.png)
![Life expectancy with calculated sex gap[7]](http://upload.wikimedia.org/wikipedia/commons/thumb/b/bc/Life_expectancy_by_WBG_-Germany_-diff.png/360px-Life_expectancy_by_WBG_-Germany_-diff.png)
![Life expectancy in Germany according to estimation of Our World in Data[8]](http://upload.wikimedia.org/wikipedia/commons/thumb/4/44/Life_expectancy_in_Germany.svg/319px-Life_expectancy_in_Germany.svg.png)
![Development of life expectancy in Germany in comparison to some big countries of the world[7]](http://upload.wikimedia.org/wikipedia/commons/thumb/f/f5/Life_expectancy_in_some_big_countries.png/355px-Life_expectancy_in_some_big_countries.png)
![Development of life expectancy in Germany in comparison to the largest by population European countries[7]](http://upload.wikimedia.org/wikipedia/commons/thumb/2/24/Life_expectancy_in_the_largest_European_countries.png/355px-Life_expectancy_in_the_largest_European_countries.png)
-
![Life expectancy and healthy life expectancy in Germany on the background of other countries of the world in 2019[9]](//upload.wikimedia.org/wikipedia/commons/thumb/c/c2/Healthy_life_expectancy_bar_chart_-world.png/529px-Healthy_life_expectancy_bar_chart_-world.png) Life expectancy and healthy life expectancy in Germany on the background of other countries of the world in 2019[9]
Life expectancy and healthy life expectancy in Germany on the background of other countries of the world in 2019[9] -
![Life expectancy and healthy life expectancy for males and females separately[9]](//upload.wikimedia.org/wikipedia/commons/thumb/d/d0/Healthy_life_expectancy_bar_chart_-world_-sex.png/529px-Healthy_life_expectancy_bar_chart_-world_-sex.png) Life expectancy and healthy life expectancy for males and females separately[9]
Life expectancy and healthy life expectancy for males and females separately[9]
![Life expectancy and healthy life expectancy in Germany on the background of other countries of the world in 2019[9]](http://upload.wikimedia.org/wikipedia/commons/thumb/c/c2/Healthy_life_expectancy_bar_chart_-world.png/529px-Healthy_life_expectancy_bar_chart_-world.png)
![Life expectancy and healthy life expectancy for males and females separately[9]](http://upload.wikimedia.org/wikipedia/commons/thumb/d/d0/Healthy_life_expectancy_bar_chart_-world_-sex.png/529px-Healthy_life_expectancy_bar_chart_-world_-sex.png)
-
![Life expectancy and healthy life expectancy in Germany on the background of other countries of Europe in 2019[9]](//upload.wikimedia.org/wikipedia/commons/thumb/9/93/Healthy_life_expectancy_bar_chart_-Europe.png/530px-Healthy_life_expectancy_bar_chart_-Europe.png) Life expectancy and healthy life expectancy in Germany on the background of other countries of Europe in 2019[9]
Life expectancy and healthy life expectancy in Germany on the background of other countries of Europe in 2019[9] -
![Life expectancy and healthy life expectancy for males and females separately[9]](//upload.wikimedia.org/wikipedia/commons/thumb/1/13/Healthy_life_expectancy_bar_chart_-Europe_-sex.png/530px-Healthy_life_expectancy_bar_chart_-Europe_-sex.png) Life expectancy and healthy life expectancy for males and females separately[9]
Life expectancy and healthy life expectancy for males and females separately[9]
![Life expectancy and healthy life expectancy in Germany on the background of other countries of Europe in 2019[9]](http://upload.wikimedia.org/wikipedia/commons/thumb/9/93/Healthy_life_expectancy_bar_chart_-Europe.png/530px-Healthy_life_expectancy_bar_chart_-Europe.png)
![Life expectancy and healthy life expectancy for males and females separately[9]](http://upload.wikimedia.org/wikipedia/commons/thumb/1/13/Healthy_life_expectancy_bar_chart_-Europe_-sex.png/530px-Healthy_life_expectancy_bar_chart_-Europe_-sex.png)
See also
Wikimedia Commons has media related to Life expectancy charts for Germany.
- List of countries by life expectancy
- List of European countries by life expectancy
- Demographics of Germany
References
- ^ a b c "Deaths, life expectancy: Life expectancy by sex and state". Federal Statistical Office of Germany. Retrieved 3 February 2024.
- ^ a b "Sterbefälle und Lebenserwartung: Durchschnittliche fernere Lebenserwartung (Periodensterbetafel) in den Bundesländern für Männer". Federal Statistical Office of Germany (in German). Retrieved 3 February 2024.
- ^ a b "Sterbefälle und Lebenserwartung: Durchschnittliche fernere Lebenserwartung (Periodensterbetafel) in den Bundesländern für Frauen". Federal Statistical Office of Germany (in German). Retrieved 3 February 2024.
- ^ "Lebenserwartung in Deutschland nach Bundesländern und Geschlecht 2015/2017 | Statistik". Statista (in German). Retrieved 2018-12-10.
- ^ a b "Life expectancy at birth by sex and NUTS 2 region". Eurostat. 14 March 2024. Retrieved 28 March 2024. — Dataset
- ^ a b "Life expectancy at birth by sex and NUTS 2 region". Eurostat. 14 March 2024. Retrieved 28 March 2024. — Table. For visualization use tab "Map"
- ^ a b c d "Life expectancy at birth, total - Germany". World Bank Group.
- ^ "Life expectancy at birth: Germany". Our World in Data.
- ^ a b c d "Life expectancy and Healthy life expectancy, data by country". World Health Organization. 2020. Retrieved 1 February 2024.