
No higher resolution available.
CAP2004beneficiaries.png (714 × 468 pixels, file size: 9 KB, MIME type: image/png)
| This is a file from the Wikimedia Commons. Information from its description page there is shown below. Commons is a freely licensed media file repository. You can help. |
La bildo estas kopiita de wikipedia:en. La originala priskribo estas:
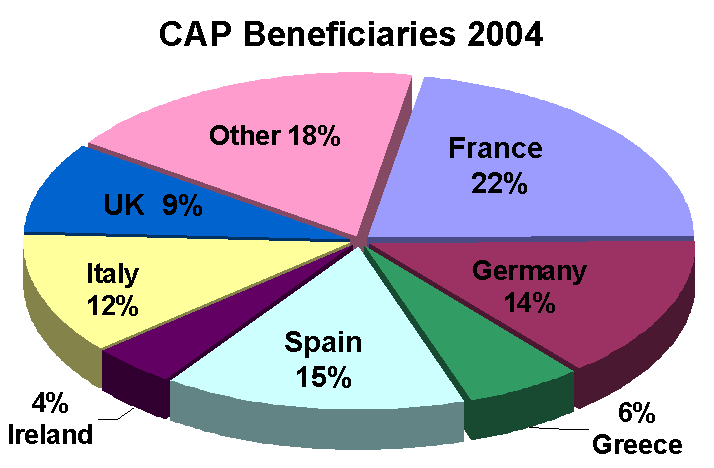
Pie chart illustrating percentage of EU spending on CAP going to different member states 2004. Drawn by me, December 2005.
| This work has been released into the public domain by its author, Sandpiper at English Wikipedia. This applies worldwide. In some countries this may not be legally possible; if so: Sandpiper grants anyone the right to use this work for any purpose, without any conditions, unless such conditions are required by law. |
| date/time | username | edit summary |
|---|---|---|
| 13:24, 18 December 2005 | en:User:Sandpiper | (wish there was simple information of licensing tags) |
| 13:15, 18 December 2005 | en:User:Sandpiper | (Pie chart illustrating percentage of EU spending on CAP going to different member states 2004. Drawn by me, December 2005) |


|
This chart image could be re-created using vector graphics as an SVG file. This has several advantages; see Commons:Media for cleanup for more information. If an SVG form of this image is available, please upload it and afterwards replace this template with
{{vector version available|new image name}}.
It is recommended to name the SVG file “CAP2004beneficiaries.svg”—then the template Vector version available (or Vva) does not need the new image name parameter. |
Original upload log
Legend: (cur) = this is the current file, (del) = delete this old version, (rev) = revert to this old version.
Click on date to download the file or see the image uploaded on that date.
- (del) (cur) 13:15, 18 December 2005 . . en:User:Sandpiper Sandpiper ( en:User_talk:Sandpiper Talk) . . 714x468 (12640 bytes) (Pie chart illustrating percentage of EU spending on CAP going to different member states 2004. Drawn by me, December 2005)
en:Image:CAP2004beneficiaries.gif
Original upload log
| Date/Time | Dimensions | User | Comment |
|---|---|---|---|
| 1 April 2006, 07:47:10 | 714 × 468 (12640 bytes) | Maksim (talk · contribs) | La bildo estas kopiita de wikipedia:en. La originala priskribo estas: Pie chart illustrating percentage of EU spending on CAP going to different member states 2004. Drawn by me, December 2005.{{PD-user|[[User:Sandpiper|Sandpiper]]}} {| border="1" ! date |
File history
Click on a date/time to view the file as it appeared at that time.
| Date/Time | Thumbnail | Dimensions | User | Comment | |
|---|---|---|---|---|---|
| current | 01:03, 28 August 2014 | | 714 × 468 (9 KB) | <bdi>GifTagger</bdi> | Bot: Converting file to superior PNG file. (Source: CAP2004beneficiaries.gif). This GIF was problematic due to non-greyscale color table. |
File usage
The following pages on the English Wikipedia use this file (pages on other projects are not listed):
Global file usage
The following other wikis use this file:
- Usage on eo.wikipedia.org
- Usage on fr.wikipedia.org
- Usage on ja.wikipedia.org
- Usage on pt.wikipedia.org