

Size of this PNG preview of this SVG file: 631 × 599 pixels. Other resolutions: 253 × 240 pixels | 505 × 480 pixels | 808 × 768 pixels | 1,078 × 1,024 pixels | 2,156 × 2,048 pixels.
Original file (SVG file, nominally 800 × 760 pixels, file size: 4 KB)
| This is a file from the Wikimedia Commons. Information from its description page there is shown below. Commons is a freely licensed media file repository. You can help. |
Summary
| Description |
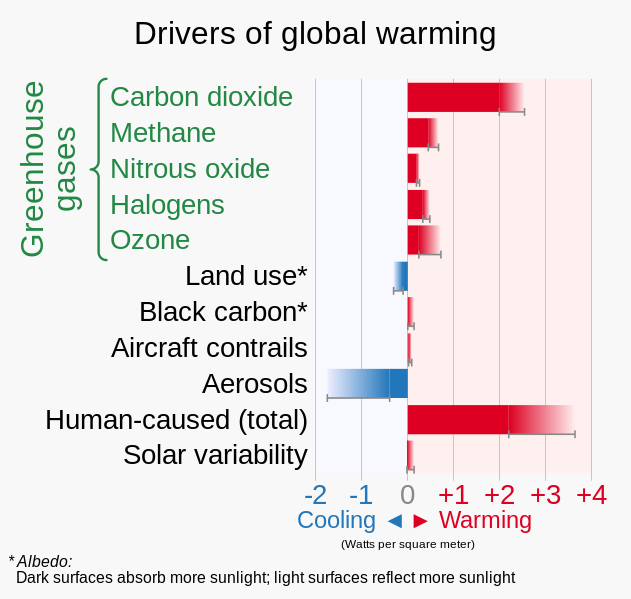
Chart showing radiative forcing (warming influence) of various drivers of global warming,
|
||
| Date | |||
| Source | Own work | ||
| Author | RCraig09 | ||
| Other versions |
 |
_-_global_warming.svg)
_-_global_warming_svg)
_-_global_warming.svg)
_-_global_warming.svg)
Licensing
I, the copyright holder of this work, hereby publish it under the following license:
This file is licensed under the Creative Commons Attribution-Share Alike 4.0 International license.
- You are free:
- to share – to copy, distribute and transmit the work
- to remix – to adapt the work
- Under the following conditions:
- attribution – You must give appropriate credit, provide a link to the license, and indicate if changes were made. You may do so in any reasonable manner, but not in any way that suggests the licensor endorses you or your use.
- share alike – If you remix, transform, or build upon the material, you must distribute your contributions under the same or compatible license as the original.
File history
Click on a date/time to view the file as it appeared at that time.
| Date/Time | Thumbnail | Dimensions | User | Comment | |
|---|---|---|---|---|---|
| current | 06:56, 9 December 2023 | | 800 × 760 (4 KB) | RCraig09 | Version 4: color tint chart background . . . remove horizontal grid lines . . . |
| 23:40, 8 December 2023 |  | 800 × 760 (4 KB) | RCraig09 | Version 3: changed aspect ratio . . added Aircraft contrails . . . changed to "solar variability" | |
| 17:25, 7 December 2023 |  | 1,200 × 675 (4 KB) | RCraig09 | Version 2: explain albedo . . . change horizontal axis legend . . . lighten confidence interval bars . . . per Talk:Climate change at en.WP | |
| 17:39, 6 December 2023 |  | 1,200 × 675 (4 KB) | RCraig09 | Uploaded own work with UploadWizard |
File usage
The following pages on the English Wikipedia use this file (pages on other projects are not listed):
Global file usage
The following other wikis use this file:
- Usage on ko.wikipedia.org
_-_global_warming.svg)