

Original file (1,920 × 1,080 pixels, file size: 2.22 MB, MIME type: image/png)
| This is a file from the Wikimedia Commons. Information from its description page there is shown below. Commons is a freely licensed media file repository. You can help. |
Summary
| Description |
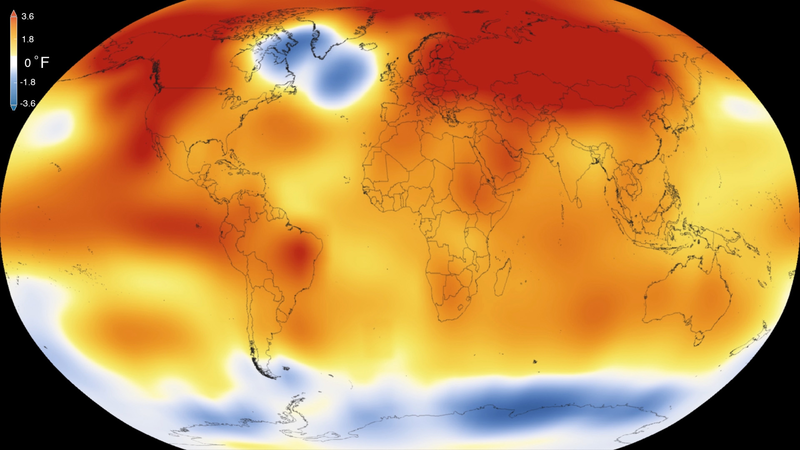
NASA 16-008 - January 20, 2016 - 2015 Global Temperatures
NASA, NOAA ANALYSES REVEAL RECORD-SHATTERING GLOBAL WARM TEMPERATURES IN 2015
2015 was the warmest year since modern record-keeping began in 1880, according to a new analysis by NASA’s Goddard Institute for Space Studies. The record-breaking year continues a long-term warming trend — 15 of the 16 warmest years on record have now occurred since 2001.
This visualization illustrates Earth’s long-term warming trend, showing temperature changes from 1880 to 2015 as a rolling five-year average. Orange colors represent temperatures that are warmer than the 1951-80 baseline average, and blues represent temperatures cooler than the baseline.
Earth’s 2015 surface temperatures were the warmest since modern record keeping began in 1880, according to independent analyses by NASA and the National Oceanic and Atmospheric Administration (NOAA). Globally-averaged temperatures in 2015 shattered the previous mark set in 2014 by 0.23 degrees Fahrenheit (0.13 Celsius). Only once before, in 1998, has the new record been greater than the old record by this much. The 2015 temperatures continue a long-term warming trend, according to analyses by scientists at NASA’s Goddard Institute for Space Studies (GISS) in New York (GISTEMP). NOAA scientists concur with the finding that 2015 was the warmest year on record based on separate, independent analyses of the data. Because weather station locations and measurements change over time, there is some uncertainty in the individual values in the GISTEMP index. Taking this into account, NASA analysis estimates 2015 was the warmest year with 94 percent certainty. “Climate change is the challenge of our generation, and NASA’s vital work on this important issue affects every person on Earth,” said NASA Administrator Charles Bolden. “Today’s announcement not only underscores how critical NASA’s Earth observation program is, it is a key data point that should make policy makers stand up and take notice - now is the time to act on climate.” The planet’s average surface temperature has risen about 1.8 degrees Fahrenheit (1.0 degree Celsius) since the late-19th century, a change largely driven by increased carbon dioxide and other human-made emissions into the atmosphere. Most of the warming occurred in the past 35 years, with 15 of the 16 warmest years on record occurring since 2001. Last year was the first time the global average temperatures were 1 degree Celsius or more above the 1880-1899 average. Phenomena such as El Niño or La Niña, which warm or cool the tropical Pacific Ocean, can contribute to short-term variations in global average temperature. A warming El Niño was in effect for most of 2015. “2015 was remarkable even in the context of the ongoing El Niño,” said GISS Director Gavin Schmidt. “Last year’s temperatures had an assist from El Niño, but it is the cumulative effect of the long-term trend that has resulted in the record warming that we are seeing.” Weather dynamics often affect regional temperatures, so not every region on Earth experienced record average temperatures last year. For example, NASA and NOAA found that the 2015 annual mean temperature for the contiguous 48 United States was the second warmest on record. NASA’s analyses incorporate surface temperature measurements from 6,300 weather stations, ship- and buoy-based observations of sea surface temperatures, and temperature measurements from Antarctic research stations. These raw measurements are analyzed using an algorithm that considers the varied spacing of temperature stations around the globe and urban heating effects that could skew the conclusions if left unaccounted for. The result of these calculations is an estimate of the global average temperature difference from a baseline period of 1951 to 1980. NOAA scientists used much of the same raw temperature data, but a different baseline period, and different methods to analyze Earth’s polar regions and global temperatures. GISS is a NASA laboratory managed by the Earth Sciences Division of the agency’s Goddard Space Flight Center in Greenbelt, Maryland. The laboratory is affiliated with Columbia University’s Earth Institute and School of Engineering and Applied Science in New York. NASA monitors Earth's vital signs from land, air and space with a fleet of satellites, as well as airborne and ground-based observation campaigns. The agency develops new ways to observe and study Earth's interconnected natural systems with long-term data records and computer analysis tools to better see how our planet is changing. NASA shares this unique knowledge with the global community and works with institutions in the United States and around the world that contribute to understanding and protecting our home planet. The so-called cold blob is in the upper center of the image (North Atlantic), near the southern tip of Greenland. RELATED LINKS: The full 2015 surface temperature data set and the complete methodology used to make the temperature calculation are available at: http://data.giss.nasa.gov/gistemp/ The slides for the Wednesday, Jan. 20 news conference are available at: http://go.nasa.gov/2015climate For more information about NASA's Earth science activities, visit: http://www.nasa.gov/earth |
| Date | |
| Source | http://www.nasa.gov/sites/default/files/thumbnails/image/16-008.jpeg |
| Author | NASA Scientific Visualization Studio - https://svs.gsfc.nasa.gov / Goddard Space Flight Center - https://www.nasa.gov/centers/goddard |
Licensing
| This file is in the public domain in the United States because it was solely created by NASA. NASA copyright policy states that "NASA material is not protected by copyright unless noted". (See Template:PD-USGov, NASA copyright policy page or JPL Image Use Policy.) | ||
 |
Warnings:
|
File history
Click on a date/time to view the file as it appeared at that time.
| Date/Time | Thumbnail | Dimensions | User | Comment | |
|---|---|---|---|---|---|
| current | 14:47, 21 January 2016 | | 1,920 × 1,080 (2.22 MB) | Drbogdan | User created page with UploadWizard |
File usage
More than 100 pages use this file. The following list shows the first 100 pages that use this file only. A full list is available.
- Atmospheric Model Intercomparison Project
- Committee on Climate Change Science and Technology Integration
- Weather
View more links to this file.
Global file usage
The following other wikis use this file:
- Usage on ar.wikipedia.org
- Usage on bcl.wikipedia.org
- Olay:Karbon dioksido
- Olay:Petrolyo
- Olay:Inhinyeriyang pangkapalibotan
- Olay:Inhinyeriyang pagmimina
- Olay:Bagas
- Olay:Fikile Ntshangase
- Olay:Helena Gualinga
- Olay:Nina Gualinga
- Olay:Adélaïde Charlier
- Olay:Alexandria Villaseñor
- Olay:Vanessa Nakate
- Olay:Sea Rotmann
- Olay:Noga Levy-Rapoport
- Olay:Maria Auma
- Olay:Isra Hirsi
- Olay:Greta Thunberg
- Olay:Farhana Yamin
- Olay:Anuna De Wever
- Olay:Aliénor Rougeot
- Olay:Mitzi Jonelle Tan
- Olay:Kehkashan Basu
- Olay:Editar Adhiambo Ochieng
- Olay:Noelene Nabulivou
- Plantilya:WikiProyekto Klima
- Olay:Hayat Mirshad
- Olay:Desmond D'Sa
- Olay:Destiny Watford
- Olay:Mikiko Kainuma
- Olay:Karapatan sa marhay na kapalibutan
- Olay:Tag-alang
- Olay:Fossil fuel
- Olay:Polusyon sa salog kan Pasig
- Olay:Mga isyung pankapalibutan sa Pilipinas
- Olay:Greenhouse gas
- Olay:Polusyon sa Duros
- Olay:Antartika
- Olay:Holly Gillibrand
- Olay:Biglaan na pagbago kan klima
- Usage on bh.wikipedia.org
- Usage on bn.wikipedia.org
- Usage on bs.wikipedia.org
- Usage on ca.wikipedia.org
- Usage on cs.wikipedia.org
- Usage on da.wikipedia.org
- Usage on de.wikipedia.org
View more global usage of this file.