The climate of Antarctica is the coldest on Earth. The continent is also extremely dry (it is a desert[1]), averaging 166 mm (6.5 in) of precipitation per year. Snow rarely melts on most parts of the continent, and, after being compressed, becomes the glacier ice that makes up the ice sheet. Weather fronts rarely penetrate far into the continent, because of the katabatic winds. Most of Antarctica has an ice-cap climate (Köppen classification EF) with extremely cold and dry weather.
YouTube Encyclopedic
-
1/5Views:4 479 9996 63521 6221 376 452362 155
-
The Arctic vs. the Antarctic - Camille Seaman
-
Antarctic Weather
-
Why Antarctica Depends on This Little Creature I Climate Heroes
-
Antarctica: A message from another planet | DW Documentary
-
What Would Happen if Antarctica Completely Melted?
Transcription
On our planet, we have two polar regions: the Arctic, whose name comes from the Greek Arktikos, of the North, and the Antarctic from Antarktikos, opposite of the North. But there's an easier way to remember them if you just remember what surrounds them. The Arctic, situated in the Northern hemisphere of our planet, is an ocean entirely surrounded by land. On the other side of the world, the Antarctic is a continent entirely surrounded by ocean. So, the Arctic has polar bears but no penguins, and the Antarctic has penguins but no polar bears. Let's talk about the Arctic first. The Arctic region consists of a vast, ice-covered ocean surrounded by treeless permafrost. The area can be defined as the region between the Arctic Circle and the North Pole. If you were to stand at the North Pole, everywhere you looked, in all directions, would be south. But standing at the North Pole is difficult to do for very long because it's in the middle of an ocean, covered by constantly shifting, frozen sea ice. If you were to fall into the water at the North Pole, you'd fall into water that's 13,980 feet deep. Above the water, average winter temperatures can be as low as -40 degrees Celsius, and the coldest recorded temperature is approximately -68 degrees Celsius. Despite these incredibly harsh conditions, humans have populated areas in the Arctic for thousands of years. Life in the Arctic includes organisms living in the ice, zooplankton and phytoplankton, fish and marine mammals, birds, land animals, plants, and human societies. Okay, what about Antarctica? Antarctica is Earth's southernmost continent, and it contains the geographic South Pole. It's the fifth largest continent on the planet at nearly twice the size of Australia. Almost 98% of Anarctica is covered by ice at least one mile in thickness. Conditions in Antarctica are some of the most extreme in the entire world. On average, it's the coldest, windiest, driest continent and has the highest average elevation of all the continents. You might think that it snows all the time at the Poles, but Antarctica is so dry, it's considered a desert with annual precipitation of only 200 millimeters along the coast and far less inland. The temperature in Antarctica has reached -89 degrees Celsius. Because it's so harsh and hard to get to, there are no permanent human residents on Antarctica, but anywhere from 1,000 to 5,000 people reside throughout the year at the research stations scattered across the continent. Even the most extreme animals fight for survival, and only cold-adapted organisms survive there, including many types of algae, animals, bacteria, fungi, plants, and protista. But why is Antarctica colder than its northern cousin? Well, first, much of the continent is more than three kilometers above sea level, and temperature decreases with elevation. That's why mountaintops have snow on them. Second, remember that the Arctic is really a frozen ocean. The water in the ocean beneath it is warmer than the frozen ground in the Antarctic, and that warmth is transferred through the ice pack. This prevents temperatures in the Arctic regions from reaching the extremes typical of the land surface of Antarctica. Third, the seasons are conspiring against the Antarctic. During the aphelion in July, when the Earth is the farthest away from the Sun, it also happens to be winter in the Antarctic, which creates a double-whammy of cold for the southern pole. But despite being inhospitable, the North and South Pole are a big reason why our planet is the way it is. Both of our polar regions are very important climate controllers. They help moderate the temperature in our temperate zones and give us stable weather. As sea ice in the Arctic declines due to climate change and global warming, weather around the globe becomes increasing more unstable.
Temperature
The highest temperature ever recorded on Antarctica was 19.8 °C (67.6 °F) recorded at Signy Research Station, Signy Island on 30 January 1982.[2][3]
The highest temperature on the Antarctic mainland was 18.3 °C (64.9 °F) at the Esperanza Base (Argentina) on 6 February 2020.[4]

The lowest air temperature record, the lowest reliably measured temperature on Antarctica was set on 21 July 1983, when a temperature of −89.2 °C (−128.6 °F) was observed at Vostok Station.[2][5] For comparison, this is 10.7 °C (19.3 °F) colder than subliming dry ice (at sea level pressure). The elevation of the location is 3,488 meters (11,444 feet).
Satellite measurements have identified even lower ground temperatures, with −93.2 °C (−135.8 °F) having been observed at the cloud-free East Antarctic Plateau on 10 August 2010.[6]
The lowest recorded temperature of any location on Earth's surface at 81°48′S 63°30′E / 81.8°S 63.5°E was revised with new data in 2018 in nearly 100 locations, ranging from −93.2 °C (−135.8 °F)[7] to −98 °C (−144.4 °F).[8] This unnamed part of the Antarctic plateau, between Dome A and Dome F, was measured on 10 August 2010, and the temperature was deduced from radiance measured by the Landsat 8 and other satellites. It was discovered during a National Snow and Ice Data Center review of stored data in December 2013[9] but revised by researchers on 25 June 2018.[10][11] This temperature is not directly comparable to the –89.2 °C reading quoted above, since it is a skin temperature deduced from satellite-measured upwelling radiance, rather than a thermometer-measured temperature of the air 1.5 m (5 ft) above the ground surface.
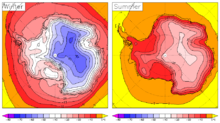
The mean annual temperature of the interior is −43.5 °C (−46.3 °F).[12] The coast is warmer; on the coast Antarctic average temperatures are around −10 °C (14.0 °F) (in the warmest parts of Antarctica) and in the elevated inland they average about −55 °C (−67.0 °F) in Vostok.[13][14] Monthly means at McMurdo Station range from −26 °C (−14.8 °F) in August to −3 °C (26.6 °F) in January.[15] At the South Pole, the highest temperature ever recorded was −12.3 °C (9.9 °F) on 25 December 2011.[16] Along the Antarctic Peninsula, temperatures as high as 18.3 °C (64.9 °F) have been recorded,[clarification needed] though the summer temperature is below 0 °C (32 °F) most of the time. Severe low temperatures vary with latitude, elevation, and distance from the ocean. East Antarctica is colder than West Antarctica because of its higher elevation.[citation needed] The Antarctic Peninsula has the most moderate climate. Higher temperatures occur in January along the coast and average slightly below freezing.
Precipitation
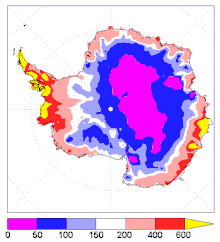
The total precipitation on Antarctica, averaged over the entire continent, is about 166 millimetres (6.5 inches) per year (Vaughan et al., J. Clim., 1999). The actual rates vary widely, from high values over the Peninsula (15 to 25 inches a year) to very low values (as little as 50 millimetres (2.0 inches) in the high interior (Bromwich, Reviews of Geophysics, 1988). Areas that receive less than 250 millimetres (9.8 inches) of precipitation per year are classified as deserts. Almost all Antarctic precipitation falls as snow.[17] Rainfall is rare and mainly occurs during the summer in coastal areas and surrounding islands.[17] Note that the quoted precipitation is a measure of its equivalence to water, rather than being the actual depth of snow. The air in Antarctica is also very dry. The low temperatures result in a very low absolute humidity, which means that dry skin and cracked lips are a continual problem for scientists and expeditioners working on the continent.
Weather condition classification
The weather in Antarctica can be highly variable, and the weather conditions can often change dramatically in short periods of time. There are various classifications for describing weather conditions in Antarctica; restrictions given to workers during the different conditions vary by station and nation.[18][19][20]
Ice cover
Nearly all of Antarctica is covered by a sheet of ice that is, on average, at least 1,500 m (5,000 ft) thick. Antarctica contains 90% of the world's ice and more than 70% of its fresh water. If all the land-ice covering Antarctica were to melt — around 30×106 km3 (7.2×10⁶ cu mi) of ice — the seas would rise by over 60 m (200 ft).[21] The Antarctic is so cold that even with increases of a few degrees, temperatures would generally remain below the melting point of ice. Higher temperatures are expected to lead to more precipitation, which takes the form of snow. This would increase the amount of ice in Antarctica, offsetting approximately one third of the expected sea level rise from thermal expansion of the oceans.[22] During a recent[when?] decade, East Antarctica thickened at an average rate of about 1.8 cm (11⁄16 in) per year while West Antarctica showed an overall thinning of 0.9 cm (3⁄8 in) per year.[23] For the contribution of Antarctica to present and future sea level change, see sea level rise. Because ice flows, albeit slowly, the ice within the ice sheet is younger than the age of the sheet itself.
| Surface | Area (km²) |
Percent | Mean ice thickness (m) |
Volume (km3) |
Percent |
|---|---|---|---|---|---|
| Inland ice sheet | 11,965,700 | 85.97 | 2,450 | 29,324,700 | 97.00 |
| Ice shelves | 1,541,710 | 11.08 | 475 | 731,900 | 2.43 |
| Ice rises | 78,970 | .57 | 670 | 53,100 | .18 |
| Glacier ice (total) | 13,586,380 | 2,160 | 30,109,800¹ | ||
| Rock outcrop | 331,690 | 2.38 | |||
| Antarctica (total) | 13,918,070 | 100.00 | 2,160 | 30,109,800¹ | 100.00 |
| ¹The total ice volume is different from the sum of the component parts because individual figures have been rounded. | |||||
| Region | Area (km²) |
Mean ice thickness (m) |
Volume (km3) |
|---|---|---|---|
| East Antarctica | |||
| Inland ice | 9,855,570 | 2,630 | 25,920,100 |
| Ice shelves | 293,510 | 400 | 117,400 |
| Ice rises | 4,090 | 400 | 1,600 |
| West Antarctica (excluding Antarctic Peninsula) | |||
| Inland ice sheet | 1,809,760 | 1,780 | 3,221,400 |
| Ice shelves | 104,860 | 375 | 39,300 |
| Ice rises | 3,550 | 375 | 1,300 |
| Antarctic Peninsula | |||
| Inland ice sheet | 300,380 | 610 | 183,200 |
| Ice shelves | 144,750 | 300 | 43,400 |
| Ice rises | 1,570 | 300 | 500 |
| Ross Ice Shelf | |||
| Ice shelf | 525,840 | 427 | 224,500 |
| Ice rises | 10,320 | 500 | 5,100 |
| Filchner-Ronne Ice Shelf | |||
| Ice shelf | 472,760 | 650 | 307,300 |
| Ice rises | 59,440 | 750 | 44,600 |
Ice shelves

About 75% of the coastline of Antarctica is ice shelf. The majority of ice shelf consists of floating ice, and a lesser amount consists of glaciers that move slowly from the land mass into the sea. Ice shelves lose mass through breakup of glacial ice (calving), or basal melting due to warm ocean water under the ice.[24]
Melting or breakup of floating shelf ice does not directly affect global sea levels; however, ice shelves have a buttressing effect on the ice flow behind them. If ice shelves break up, the ice flow behind them may accelerate, resulting in increasing melt of the Antarctic ice sheet and an increasing contribution to sea level rise.
Known changes in coastline ice around the Antarctic Peninsula:
- 1936–1989: Wordie Ice Shelf significantly reduced in size.
- 1995: Ice in the Prince Gustav Channel disintegrated.
- Parts of the Larsen Ice Shelf broke up in recent decades.
- 1995: The Larsen A ice shelf disintegrated in January 1995.
- 2001: 3,250 km2 (1,250 sq mi) of the Larsen B ice shelf disintegrated in February 2001. It had been gradually retreating before the breakup event.
- 2015: A study concluded that the remaining Larsen B ice-shelf will disintegrate by the end of the decade, based on observations of faster flow and rapid thinning of glaciers in the area.[25]
The George VI Ice Shelf, which may be on the brink of instability,[26] has probably existed for approximately 8,000 years, after melting 1,500 years earlier.[27] Warm ocean currents may have been the cause of the melting.[28] Not only are the ice sheets losing mass, they are losing mass at an accelerating rate.[29]
Climate change
Climate change caused by greenhouse gas emissions from human activities occurs everywhere on Earth, and while Antarctica is less vulnerable to it than any other continent,[30] climate change in Antarctica has already been observed. There has been an average temperature increase of >0.05 °C/decade since 1957 across the continent, although it had been uneven.[31] While West Antarctica warmed by over 0.1 °C/decade from the 1950s to the 2000s and the exposed Antarctic Peninsula has warmed by 3 °C (5.4 °F) since the mid-20th century,[32] the colder and more stable East Antarctica had been experiencing cooling until the 2000s.[33][34] Around Antarctica, the Southern Ocean has absorbed more heat than any other ocean,[35] with particularly strong warming at depths below 2,000 m (6,600 ft)[36]: 1230 and around the West Antarctic, which has warmed by 1 °C (1.8 °F) since 1955.[32]
The warming of Antarctica's territorial waters has caused the weakening or outright collapse of ice shelves, which float just offshore of glaciers and stabilize them. Many coastal glaciers have been losing mass and retreating, which causes net annual ice loss across Antarctica,[36]: 1264 even as the East Antarctic ice sheet continues to gain ice inland. By 2100, net ice loss from Antarctica alone is expected to add about 11 cm (5 in) to global sea level rise. However, marine ice sheet instability may cause West Antarctica to contribute tens of centimeters more if it is triggered before 2100.[36]: 1270 With higher warming instability would be much more likely, and could double overall 21st century sea level rise.[37][38][39]See also
- Antarctic oscillation
- Antarctica cooling controversy
- Climate of the Arctic
- Effects of global warming
- Polar amplification
- Retreat of glaciers since 1850
- Southern Ocean
References
Notes
- ^ "Frequently Asked Questions about Antarctica". nasa.gov. NASA. Retrieved 5 May 2024.
- ^ a b "WMO verifies highest temperatures for Antarctic Region". 1 March 2017. Archived from the original on 18 December 2023. Retrieved 12 July 2018.
- ^ "WMO verifies one temperature record for Antarctic continent and rejects another". World Meteorological Organization. 1 July 2021. Retrieved 3 July 2021.
- ^ "WMO verifies one temperature record for Antarctic continent and rejects another". The World Meteorological Organization (WMO). 1 July 2021. Retrieved 17 May 2022.
- ^ "World: Lowest Temperature - ASU World Meteorological Organization". asu.edu. Archived from the original on 16 June 2010.
- ^ Coldest spot on Earth identified by satellite Archived 14 April 2016 at the Wayback Machine, Jonathan Amos, BBC News, 9 December 2013.
- ^ Natasha Vizcarra (9 December 2013). "Landsat 8 helps unveil the coldest place on Earth". National Snow and Ice Data Center. Archived from the original on 20 December 2013. Retrieved 27 December 2013.
- ^ Natasha Vizcarra (25 May 2018). "New study explains Antarctica's coldest temperatures". The National Snow and Ice Data Center (NSIDC). Archived from the original on 5 March 2021. Retrieved 7 August 2018.
- ^ Jonathan Amos (9 December 2013). "Coldest spot on Earth identified by satellite". BBC News Science & Environment. Archived from the original on 26 December 2013. Retrieved 27 December 2013.
- ^ Ted Scambos (25 May 2018). "Scambros et al 2018" (PDF). The National Snow and Ice Data Center (NSIDC).
- ^ NOT CORRECTED. "BBC Corrections and Clarifications page". Archived from the original on 13 October 2018. Retrieved 7 August 2018.
- ^ "Annual mean 2m Temperature for 0-150ºE, 75-90ºS, Climate Reanalyzer". Climate Change Institute, University of Maine. Retrieved 18 May 2023.
- ^ "Antarctic weather". www.antarctica.gov.au. Archived from the original on 5 November 2016.
- ^ "Antarctic climatic data". Archived from the original on 7 May 2008. Retrieved 7 May 2008.
- ^ "Antarctica Climate data and graphs, South Pole, McMurdo and Vostok". coolantarctica.com. Archived from the original on 9 October 2010. Retrieved 14 May 2014.
- ^ Matthew A. Lazzara (28 December 2011). "Preliminary Report: Record Temperatures at South Pole (and nearby AWS sites…)". Archived from the original on 30 December 2011. Retrieved 28 December 2011.
- ^ a b "La Antártida" (in Spanish). Dirección Nacional del Antártico. Archived from the original on 13 November 2016. Retrieved 13 November 2016.
- ^ "Weathering The Conditions" (PDF). The Antarctic Sun. 18 October 1997. p. 8. Archived (PDF) from the original on 9 June 2015. Retrieved 8 June 2015.
- ^ Jim Scott. "Weather and Travel" (PDF). Welcome to McMurdo Station. McMurdo Station. p. 6. Archived from the original (PDF) on 10 September 2014. Retrieved 8 June 2015.
- ^ "Field Manual" (PDF). Antarctica New Zealand. New Zealand Government. p. 37. Archived from the original (PDF) on 15 January 2015. Retrieved 8 June 2015.
- ^ "Climate Change 2001: The Scientific Basis". Grida.no. Archived from the original on 16 December 2007. Retrieved 27 March 2011.
- ^ "Climate Change 2001: The Scientific Basis". Grida.no. Archived from the original on 14 May 2011. Retrieved 27 March 2011.
- ^ Davis CH, Li Y, McConnell JR, Frey MM, Hanna E (2005). "Snowfall-Driven Growth in East Antarctic Ice Sheet Mitigates Recent Sea-Level Rise". Science. 308 (5730): 1898–1901. Bibcode:2005Sci...308.1898D. doi:10.1126/science.1110662. PMID 15905362. S2CID 31797055.
- ^ E. Rignot; S. Jacobs; J. Mouginot; B. Scheuchl (2013). "Ice-Shelf Melting Around Antarctica". Science. 341 (6143): 266–270. Bibcode:2013Sci...341..266R. doi:10.1126/science.1235798. PMID 23765278. S2CID 206548095.
- ^ NASA (14 May 2015). "NASA Study Shows Antarctica's Larsen B Ice Shelf Nearing Its Final Act". Archived from the original on 9 June 2015.
- ^ Bentley, Mike; Hodgson, Dominic. "Millennial-scale variability of George VI Ice Shelf, Antarctic Peninsula". Natural Environment Research Council. Archived from the original on 12 September 2002. Retrieved 8 June 2015.
- ^ Bentley, M.J. (1), Hjort, C. (2) Ingolfsson, O. (3) and Sugden, D.E. (4). "Holocene Instability of the George VI Ice Shelf, Antarctic Peninsula". Archived from the original on 20 October 2004. Retrieved 8 June 2015.
{{cite web}}: CS1 maint: multiple names: authors list (link) CS1 maint: numeric names: authors list (link) - ^ "Press Release – New Year's Honours for British Antarctic Survey Personnel". British Antarctic Survey. 5 January 2006. Archived from the original on 15 December 2006.
- ^ "NASA - Is Antarctica Melting?". www.nasa.gov. Archived from the original on 12 December 2016.
- ^ Singh, Hansi A.; Polvani, Lorenzo M. (10 January 2020). "Low Antarctic continental climate sensitivity due to high ice sheet orography". npj Climate and Atmospheric Science. 3 (1): 39. Bibcode:2020npjCA...3...39S. doi:10.1038/s41612-020-00143-w. S2CID 222179485.
- ^ Steig, Eric; Schneider, David; Rutherford, Scott; Mann, Michael E.; Comiso, Josefino; Shindell, Drew (1 January 2009). "Warming of the Antarctic ice-sheet surface since the 1957 International Geophysical Year". Arts & Sciences Faculty Publications.
- ^ a b "Impacts of climate change". Discovering Antarctica. Retrieved 15 May 2022.
- ^ Clem, Kyle R.; Fogt, Ryan L.; Turner, John; Lintner, Benjamin R.; Marshall, Gareth J.; Miller, James R.; Renwick, James A. (August 2020). "Record warming at the South Pole during the past three decades". Nature Climate Change. 10 (8): 762–770. Bibcode:2020NatCC..10..762C. doi:10.1038/s41558-020-0815-z. ISSN 1758-6798. S2CID 220261150.
- ^ Xin, Meijiao; Clem, Kyle R; Turner, John; Stammerjohn, Sharon E; Zhu, Jiang; Cai, Wenju; Li, Xichen (2 June 2023). "West-warming East-cooling trend over Antarctica reversed since early 21st century driven by large-scale circulation variation". Environmental Research Letters. 18 (6): 064034. doi:10.1088/1748-9326/acd8d4.
- ^ Bourgeois, Timothée; Goris, Nadine; Schwinger, Jörg; Tjiputra, Jerry F. (17 January 2022). "Stratification constrains future heat and carbon uptake in the Southern Ocean between 30°S and 55°S". Nature Communications. 13 (1): 340. Bibcode:2022NatCo..13..340B. doi:10.1038/s41467-022-27979-5. PMC 8764023. PMID 35039511.
- ^ a b c Fox-Kemper, B.; Hewitt, H.T.; Xiao, C.; Aðalgeirsdóttir, G.; Drijfhout, S.S.; Edwards, T.L.; Golledge, N.R.; Hemer, M.; Kopp, R.E.; Krinner, G.; Mix, A. (2021). Masson-Delmotte, V.; Zhai, P.; Pirani, A.; Connors, S.L.; Péan, C.; Berger, S.; Caud, N.; Chen, Y.; Goldfarb, L. (eds.). "Chapter 9: Ocean, Cryosphere and Sea Level Change" (PDF). Climate Change 2021: The Physical Science Basis. Contribution of Working Group I to the Sixth Assessment Report of the Intergovernmental Panel on Climate Change. Cambridge University Press, Cambridge, UK and New York, NY, USA: 1270–1272.
- ^ Nauels, Alexander; Rogelj, Joeri; Schleussner, Carl-Friedrich; Meinshausen, Malte; Mengel, Matthias (1 November 2017). "Linking sea level rise and socioeconomic indicators under the Shared Socioeconomic Pathways". Environmental Research Letters. 12 (11): 114002. Bibcode:2017ERL....12k4002N. doi:10.1088/1748-9326/aa92b6. hdl:20.500.11850/230713.
- ^ L. Bamber, Jonathan; Oppenheimer, Michael; E. Kopp, Robert; P. Aspinall, Willy; M. Cooke, Roger (May 2019). "Ice sheet contributions to future sea-level rise from structured expert judgment". Proceedings of the National Academy of Sciences. 116 (23): 11195–11200. Bibcode:2019PNAS..11611195B. doi:10.1073/pnas.1817205116. PMC 6561295. PMID 31110015.
- ^ Horton, Benjamin P.; Khan, Nicole S.; Cahill, Niamh; Lee, Janice S. H.; Shaw, Timothy A.; Garner, Andra J.; Kemp, Andrew C.; Engelhart, Simon E.; Rahmstorf, Stefan (8 May 2020). "Estimating global mean sea-level rise and its uncertainties by 2100 and 2300 from an expert survey". npj Climate and Atmospheric Science. 3 (1): 18. Bibcode:2020npjCA...3...18H. doi:10.1038/s41612-020-0121-5. hdl:10356/143900. S2CID 218541055.
Sources
- D. G. Vaughan; G. J. Marshall; W. M. Connolley; J. C. King; R. M. Mulvaney (2001). "Devil in the detail". Science. 293 (5536): 1777–9. doi:10.1126/science.1065116. PMID 11546858. S2CID 129175116.
- M.J. Bentley; D.A. Hodgson; D.E. Sugden; S.J. Roberts; J.A. Smith; M.J. Leng; C. Bryant (2005). "Early Holocene retreat of the George VI Ice Shelf, Antarctic Peninsula". Geology. 33 (3): 173–6. Bibcode:2005Geo....33..173B. doi:10.1130/G21203.1.
Further reading
- Warm Snap Turned Antarctica Green Around the Edges; Thawed-out continent was lined with trees 15 million years ago, study says. 20 June 2012 National Geographic
- Taking Antarctica's temperature; Frozen continent may not be immune to global warming 27 July 2013; Vol.184 #2 Science News
External links
Climate
- Temperature data from the READER project
- A pamphlet about the weather and climate of Antarctica
- Antarctica's central ice cap grows while glaciers melt
- "AWS and AMRC Real-Time Weather Observations and Data". University of Wisconsin–Madison's Antarctic Weather Stations Project and Antarctic Meteorological Research Center. Retrieved 31 May 2005.
- Antarctica Climate and Weather
Climate change in Antarctica
- Western Antarctica warming confirmed 23 December 2012 USA Today
- NASA experts explain ice melt in Antarctica (2014)
Antarctic ice
- "Sea Ice Index – Trends in extent – Southern Hemisphere (Antarctic)". National Snow and Ice Data Center. Retrieved 9 January 2009.
- "Coastal-Change and Glaciological Maps of Antarctica". USGS Fact Sheet 2005–3055. Retrieved 31 May 2005.
- "Coastal-Change and Glaciological Maps of Antarctica". USGS Fact Sheet 050–98. Archived from the original on 6 February 2005. Retrieved 28 February 2005.
- "Coastal-change and glaciological map of the Eights Coast area, Antarctica; 1972–2001". U.S. Geological Survey Scientific Investigations Series Map, I-2600-E. Retrieved 28 February 2005.
- "Coastal-change and glaciological map of the Bakutis Coast area, Antarctica; 1972–2002". U.S. Geological Survey Scientific Investigations Series Map, I-2600-F. Retrieved 28 February 2005.
- "Coastal-change and glaciological map of the Saunders Coast area, Antarctica; 1972–1997". U.S. Geological Survey Scientific Investigations Series Map, I-2600-G. Retrieved 28 February 2005.
- "Satellite Image Atlas of Glaciers of the World – Antarctica". U.S. Geological Survey Professional Paper 1386-B. Archived from the original on 15 February 2005. Retrieved 28 February 2005.