
| ||||||||||||||||||||||||||
| ||||||||||||||||||||||||||
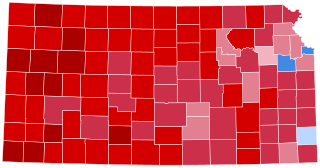 County Results
| ||||||||||||||||||||||||||
| ||||||||||||||||||||||||||


| Elections in Kansas |
|---|
 |
The 2008 United States presidential election in Kansas took place on November 4, 2008, and was part of the 2008 United States presidential election. Voters chose six representatives, or electors to the Electoral College, who voted for president and vice president.
Kansas was won by Republican nominee John McCain by a 14.9% margin of victory. Prior to the election, all 17 news organizations considered this a state McCain would win, or otherwise considered as a safe red state. He won all but three counties and one congressional district in the state. Obama still performed significantly better than Kerry, and his 41.55% of the vote remains the highest for a Democrat in the 21st century, although his running mate Joe Biden nearly matched that percentage 12 years later, with a slight reduction in margin of defeat.
As of 2020, this is the last time that Crawford County went for the Democratic candidate in a presidential election.
YouTube Encyclopedic
-
1/5Views:745702 0326 43455 2531 942 831
-
Witnesses to History: Children's Views of Race and the 2008 United States Presidential Election
-
The American Presidential Election of 2008
-
How Kansas has voted in Every Presidential Election
-
Geography of United States Elections | Lecture 1
-
Electing a US President in Plain English
Transcription
My name is Meagan Patterson and I am an assistant professor in the department of psychology and research in education at the University of Kansas. Today I’ll be talking about a paper I co-authored with Dr. Erin Pahlke of Whitman College and Dr. Rebecca Bigler of the University of Texas about children’s perception of the role of race and racial bias in the 2008 United States presidential election. This paper was published recently in Analyses of Social Issues and Public Policy. The data for this paper came from interviews we conducted with over 100 children, ages 6 to 11, shortly before and after the 2008 United States presidential election. And in this study, we asked children a series of open-ended and forced-choice questions looking at their knowledge of the candidates in the 2008 election, their perceptions of the ways that race and racial bias would influence voters' opinions of the candidates and also voters' behavior, and whether the children aspire to become president themselves. One of the first questions we wanted to examine in this study was whether children were aware that, if elected, Obama would be the first African American president. We found that children, for the most part, were quite knowledgeable about this. The majority of children were able to identify Obama as a presidential candidate and were also aware that no African Americans had previously been elected to the presidency of the United States. The second question we examined in this study was how children felt about the presence of an African American candidate in the race. And we found that, for the most part, children reacted positively to the presence of an African American candidate but that these positive responses were more common among African American children than among European American or Latino children. Although outright negative responses were rare, only 54% of European American children expressed a positive reaction to Obama's candidacy. A second question we had in this study was how children thought other people felt about the presence of an African American candidate in the race. And we found that overall, children really thought that African Americans would respond highly positively to the presence of an African American candidate. So in their responses, some children really emphasized the importance of ingroup identification for African American's positive reactions. For example, a 9-year-old Latino boy stated that African American children would be “Excited because the president would be their kind.” Other children discussed the importance of Obama as a role model. For example, a 10-year-old African American girl indicated that African American children would feel glad, and would want to be like Obama. Other children discussed Obama as someone who could potentially counter negative stereotypes of African Americans. For example, a 10-year-old European American boy stated that African American children’s reaction to Obama’s candidacy would be “Excited because it will show Black people can do just as good as White people if elected.” In contrast to the view that African Americans would react very positively to Obama’s candidacy, there was a perception that European American's reactions would be more mixed so children's responses reflected a mix of positive, negative, and neutral reactions. And this was true for children from a variety of racial backgrounds. One example of a perceived negative reaction comes from an 8-year-old African American boy, who stated that European Americans’ reaction to Obama would be that “They would feel like they would hate him. They really, really wanted McCain to win.” Some children, in contrast, believed that European Americans would, in fact, respond positively to Obama’s candidacy. For example, an 8-year-old European American boy indicated that European American children would feel excited because they had never before seen an African American candidate. Other children indicated a belief that candidate race was not important to European Americans. For example, a 10-year-old European American boy stated that he did not think the candidacy of an African American had much impact for European Americans because “race isn’t an issue anymore.” Another question we addressed in this study was whether having a same-race model elected to the presidency might potentially influence African American children’s aspirations to become president themselves. Many theories argue that having ingroup models in a particular role will influence children’s aspirations to that role; and President Obama himself has suggested that seeing him in the role of president will potentially influence African American children’s views of themselves and what they can become. So we examined children's aspirations to become president both before and after the election. And we found that aspirations to become president did not change from pre- to post-election for children from any racial group. Interestingly, however, African American children were more interested in becoming president than European American children both before and after the election. These are just a few of the findings that we report in the paper, so we really hope that you will take the time to read the paper in full. If you have any questions, please feel free to contact me by email. We hope that you have enjoyed watching this video and that you enjoy reading the paper. Thank you.
Caucuses
Campaign
Predictions
There were 16 news organizations who made state-by-state predictions of the election. Here are their last predictions before election day:
| Source | Ranking |
|---|---|
| D.C. Political Report[1] | Likely R |
| Cook Political Report[2] | Solid R |
| The Takeaway[3] | Solid R |
| Electoral-vote.com[4] | Solid R |
| Washington Post[5] | Solid R |
| Politico[6] | Solid R |
| RealClearPolitics[7] | Solid R |
| FiveThirtyEight[5] | Solid R |
| CQ Politics[8] | Solid R |
| The New York Times[9] | Solid R |
| CNN[10] | Safe R |
| NPR[5] | Solid R |
| MSNBC[5] | Solid R |
| Fox News[11] | Likely R |
| Associated Press[12] | Likely R |
| Rasmussen Reports[13] | Safe R |
Polling
McCain won every pre-election poll. Since March 16, McCain won each poll with a double-digit margin and at least 47% of the vote.[14]
Fundraising
John McCain raised a total of $1,219,074 in the state. Barack Obama raised $1,548,322.[15]
Advertising and visits
Obama spent $62,108. McCain and his interest groups spent $13,693.[16] Neither campaign visited the state.[17]
Analysis
Kansas has always been a Republican stronghold at the presidential level, voting for GOP nominees in all but seven elections since statehood. The last Democratic presidential nominee to carry Kansas was Lyndon B. Johnson in his landslide in 1964. Although the state did receive attention from Barack Obama, whose mother was born in Kansas, it wasn't enough to overcome the deeply planted GOP roots in the state. John McCain carried Kansas by a comfortable 15-percent margin of victory. McCain's margin of victory in Kansas, however, was less than that of George W. Bush who carried the state in 2004 with 62% of the vote over John Kerry's 36.62% showing in the state - a 10-point swing to the Democrats in 2008.
Obama only won three counties - Crawford (home to Pittsburg), Douglas (home to Lawrence), and Wyandotte (home to Kansas City). The first two were home to large college populations, while Wyandotte had a significant African-American population. He did, however, succeed in winning 41% of the state's popular vote. The other Democrats to have cracked the 40 percent barrier in the state since Johnson's 1964 landslide are Jimmy Carter in 1976, Michael Dukakis in 1988, and Joe Biden in 2020.
To highlight its status as a reliably red state, former State Treasurer Lynn Jenkins, a Republican, ousted incumbent Democratic U.S. Representative Nancy Boyda to win back Kansas's 2nd Congressional District seat in the U.S. House of Representatives. Jenkins received 50.80% of the vote to Boyda's 45.97%. At the same time, incumbent Republican U.S. Senator Pat Roberts was reelected with 60.06% of the vote over former Democratic U.S. Representative Jim Slattery. Republicans also made gains in the Kansas Senate, picking up one seat.
As of the 2020 presidential election[update], this is the last election in which Crawford County voted for the Democratic candidate. Obama became the first Democrat to win the White House without carrying Atchison County since John F. Kennedy in 1960.
Results
| 2008 United States presidential election in Kansas[18] | ||||||
|---|---|---|---|---|---|---|
| Party | Candidate | Running mate | Votes | Percentage | Electoral votes | |
| Republican | John McCain | Sarah Palin | 699,655 | 56.48% | 6 | |
| Democratic | Barack Obama | Joe Biden | 514,765 | 41.55% | 0 | |
| Independent | Ralph Nader | Matt Gonzalez | 10,527 | 0.85% | 0 | |
| Libertarian | Bob Barr | Wayne Allyn Root | 6,706 | 0.54% | 0 | |
| Reform | Chuck Baldwin | Darrell Castle | 4,148 | 0.33% | 0 | |
| Write-ins | Write-ins | 3,037 | 0.24% | 0 | ||
| Green | Cynthia McKinney (write-in) | Rosa Clemente | 35 | 0.00% | 0 | |
| Totals | 1,238,873 | 100.00% | 6 | |||
| Voter turnout (Voting age population) | 60.8% | |||||
Results by county
| County[19] | John McCain Republican |
Barack Obama Democratic |
Ralph Nader Independent |
Bob Barr Libertarian |
Various candidates Other parties |
Margin | Total votes cast | ||||||
|---|---|---|---|---|---|---|---|---|---|---|---|---|---|
| # | % | # | % | # | % | # | % | # | % | # | % | ||
| Allen | 3,552 | 60.67% | 2,189 | 37.39% | 67 | 1.14% | 30 | 0.51% | 17 | 0.29% | 1,363 | 23.28% | 5,855 |
| Anderson | 2,362 | 65.14% | 1,175 | 32.40% | 50 | 1.38% | 24 | 0.66% | 15 | 0.41% | 1,187 | 32.74% | 3,626 |
| Atchison | 3,791 | 52.72% | 3,241 | 45.07% | 99 | 1.38% | 37 | 0.51% | 23 | 0.32% | 550 | 7.65% | 7,191 |
| Barber | 1,833 | 74.45% | 598 | 24.29% | 14 | 0.57% | 9 | 0.37% | 8 | 0.32% | 1,235 | 50.16% | 2,462 |
| Barton | 7,802 | 70.56% | 3,027 | 27.38% | 142 | 1.28% | 52 | 0.47% | 34 | 0.31% | 4,775 | 43.18% | 11,057 |
| Bourbon | 4,240 | 62.53% | 2,394 | 35.30% | 80 | 1.18% | 32 | 0.47% | 35 | 0.52% | 1,846 | 27.23% | 6,781 |
| Brown | 2,985 | 68.21% | 1,317 | 30.10% | 42 | 0.96% | 16 | 0.37% | 16 | 0.37% | 1,668 | 38.11% | 4,376 |
| Butler | 18,155 | 65.13% | 9,159 | 32.86% | 253 | 0.91% | 170 | 0.61% | 136 | 0.49% | 8,996 | 32.27% | 27,873 |
| Chase | 976 | 70.52% | 383 | 27.67% | 12 | 0.87% | 9 | 0.65% | 4 | 0.29% | 593 | 42.85% | 1,384 |
| Chautauqua | 1,418 | 76.57% | 401 | 21.65% | 17 | 0.92% | 8 | 0.43% | 8 | 0.43% | 1,017 | 54.92% | 1,852 |
| Cherokee | 5,886 | 60.90% | 3,594 | 37.19% | 118 | 1.22% | 45 | 0.47% | 22 | 0.23% | 2,292 | 23.71% | 9,665 |
| Cheyenne | 1,148 | 76.64% | 323 | 21.56% | 13 | 0.87% | 7 | 0.47% | 7 | 0.47% | 825 | 55.08% | 1,498 |
| Clark | 897 | 77.39% | 245 | 21.14% | 6 | 0.52% | 2 | 0.17% | 9 | 0.78% | 652 | 56.25% | 1,159 |
| Clay | 2,998 | 73.95% | 1,009 | 24.89% | 28 | 0.69% | 13 | 0.32% | 6 | 0.15% | 1,989 | 49.06% | 4,054 |
| Cloud | 3,121 | 70.12% | 1,233 | 27.70% | 51 | 1.15% | 26 | 0.58% | 20 | 0.45% | 1,888 | 42.42% | 4,451 |
| Coffey | 3,054 | 72.16% | 1,121 | 26.49% | 28 | 0.66% | 19 | 0.45% | 10 | 0.24% | 1,933 | 45.67% | 4,232 |
| Comanche | 765 | 78.54% | 194 | 19.92% | 12 | 1.23% | 1 | 0.10% | 2 | 0.21% | 571 | 58.62% | 974 |
| Cowley | 8,492 | 61.59% | 5,012 | 36.35% | 162 | 1.18% | 72 | 0.52% | 49 | 0.36% | 3,480 | 25.24% | 13,787 |
| Crawford | 7,735 | 48.12% | 7,957 | 49.50% | 227 | 1.41% | 94 | 0.58% | 62 | 0.39% | -222 | -1.38% | 16,075 |
| Decatur | 1,189 | 76.81% | 343 | 22.16% | 9 | 0.58% | 3 | 0.19% | 4 | 0.26% | 846 | 54.65% | 1,548 |
| Dickinson | 6,081 | 70.16% | 2,422 | 27.95% | 75 | 0.87% | 60 | 0.69% | 29 | 0.33% | 3,659 | 42.21% | 8,667 |
| Doniphan | 2,372 | 66.55% | 1,115 | 31.29% | 32 | 0.90% | 25 | 0.70% | 20 | 0.56% | 1,257 | 35.26% | 3,564 |
| Douglas | 17,929 | 33.42% | 34,398 | 64.13% | 622 | 1.16% | 307 | 0.57% | 385 | 0.71% | -16,469 | -30.71% | 53,641 |
| Edwards | 995 | 73.32% | 333 | 24.54% | 15 | 1.11% | 12 | 0.88% | 2 | 0.15% | 662 | 48.78% | 1,357 |
| Elk | 1,042 | 72.66% | 363 | 25.31% | 10 | 0.70% | 15 | 1.05% | 4 | 0.28% | 679 | 47.35% | 1,434 |
| Ellis | 8,207 | 65.94% | 4,010 | 32.22% | 128 | 1.03% | 63 | 0.51% | 39 | 0.31% | 4,197 | 33.72% | 12,447 |
| Ellsworth | 2,021 | 68.79% | 851 | 28.97% | 39 | 1.33% | 18 | 0.61% | 9 | 0.31% | 1,170 | 39.82% | 2,938 |
| Finney | 6,926 | 66.89% | 3,275 | 31.63% | 78 | 0.75% | 48 | 0.46% | 27 | 0.26% | 3,651 | 35.26% | 10,354 |
| Ford | 5,730 | 64.64% | 2,991 | 33.74% | 57 | 0.64% | 56 | 0.63% | 30 | 0.34% | 2,739 | 30.90% | 8,864 |
| Franklin | 7,079 | 60.04% | 4,433 | 37.60% | 121 | 1.03% | 66 | 0.56% | 92 | 0.78% | 2,646 | 22.44% | 11,791 |
| Geary | 4,492 | 55.50% | 3,491 | 43.13% | 68 | 0.84% | 23 | 0.28% | 20 | 0.25% | 1,001 | 12.37% | 8,094 |
| Gove | 1,136 | 80.11% | 261 | 18.41% | 10 | 0.71% | 3 | 0.21% | 8 | 0.56% | 875 | 61.70% | 1,418 |
| Graham | 1,060 | 74.49% | 325 | 22.84% | 27 | 1.90% | 7 | 0.49% | 4 | 0.28% | 735 | 51.65% | 1,423 |
| Grant | 1,995 | 74.97% | 635 | 23.86% | 12 | 0.45% | 9 | 0.34% | 10 | 0.38% | 1,360 | 51.11% | 2,661 |
| Gray | 1,643 | 77.54% | 436 | 20.58% | 18 | 0.85% | 15 | 0.71% | 7 | 0.33% | 1,207 | 56.96% | 2,119 |
| Greeley | 591 | 79.33% | 151 | 20.27% | 2 | 0.27% | 1 | 0.13% | 0 | 0.00% | 440 | 59.06% | 745 |
| Greenwood | 1,619 | 71.04% | 622 | 27.29% | 16 | 0.70% | 14 | 0.61% | 8 | 0.35% | 997 | 43.75% | 2,279 |
| Hamilton | 844 | 77.01% | 233 | 21.26% | 7 | 0.64% | 8 | 0.73% | 4 | 0.36% | 611 | 55.75% | 1,096 |
| Harper | 1,999 | 71.49% | 736 | 26.32% | 35 | 1.25% | 15 | 0.54% | 11 | 0.39% | 1,263 | 45.17% | 2,796 |
| Harvey | 9,006 | 57.40% | 6,318 | 40.27% | 165 | 1.05% | 77 | 0.49% | 125 | 0.80% | 2,688 | 17.13% | 15,691 |
| Haskell | 1,277 | 81.34% | 278 | 17.71% | 8 | 0.51% | 4 | 0.25% | 3 | 0.19% | 999 | 63.63% | 1,570 |
| Hodgeman | 865 | 78.92% | 211 | 19.25% | 9 | 0.82% | 6 | 0.55% | 5 | 0.46% | 654 | 59.67% | 1,096 |
| Jackson | 3,811 | 60.95% | 2,308 | 36.91% | 83 | 1.33% | 29 | 0.46% | 22 | 0.35% | 1,503 | 24.04% | 6,253 |
| Jefferson | 5,220 | 58.32% | 3,542 | 39.58% | 118 | 1.32% | 54 | 0.60% | 16 | 0.18% | 1,678 | 18.74% | 8,950 |
| Jewell | 1,231 | 77.71% | 313 | 19.76% | 22 | 1.39% | 10 | 0.63% | 8 | 0.51% | 918 | 57.95% | 1,584 |
| Johnson | 152,627 | 53.70% | 127,091 | 44.72% | 1,469 | 0.52% | 1,540 | 0.54% | 1,484 | 0.52% | 25,536 | 8.98% | 284,211 |
| Kearny | 1,159 | 78.21% | 309 | 20.85% | 10 | 0.67% | 3 | 0.20% | 1 | 0.07% | 850 | 57.36% | 1,482 |
| Kingman | 2,603 | 71.04% | 963 | 26.28% | 40 | 1.09% | 35 | 0.96% | 23 | 0.63% | 1,640 | 44.76% | 3,664 |
| Kiowa | 912 | 80.35% | 200 | 17.62% | 16 | 1.41% | 5 | 0.44% | 2 | 0.18% | 712 | 62.73% | 1,135 |
| Labette | 5,001 | 55.38% | 3,839 | 42.51% | 89 | 0.99% | 56 | 0.62% | 46 | 0.51% | 1,162 | 12.87% | 9,031 |
| Lane | 814 | 79.26% | 193 | 18.79% | 8 | 0.78% | 9 | 0.88% | 3 | 0.29% | 621 | 60.47% | 1,027 |
| Leavenworth | 16,791 | 54.89% | 13,255 | 43.33% | 263 | 0.86% | 162 | 0.53% | 120 | 0.39% | 3,536 | 11.56% | 30,591 |
| Lincoln | 1,204 | 75.91% | 347 | 21.88% | 22 | 1.39% | 6 | 0.38% | 7 | 0.44% | 857 | 54.03% | 1,586 |
| Linn | 3,086 | 66.84% | 1,425 | 30.86% | 57 | 1.23% | 29 | 0.63% | 20 | 0.43% | 1,661 | 35.98% | 4,617 |
| Logan | 1,187 | 82.43% | 225 | 15.63% | 18 | 1.25% | 5 | 0.35% | 5 | 0.35% | 962 | 66.80% | 1,440 |
| Lyon | 6,698 | 51.88% | 5,924 | 45.88% | 169 | 1.31% | 68 | 0.53% | 52 | 0.40% | 774 | 6.00% | 12,911 |
| Marion | 4,159 | 68.64% | 1,801 | 29.72% | 59 | 0.97% | 23 | 0.38% | 17 | 0.28% | 2,358 | 38.92% | 6,059 |
| Marshall | 3,157 | 62.69% | 1,784 | 35.42% | 54 | 1.07% | 26 | 0.52% | 15 | 0.30% | 1,373 | 27.27% | 5,036 |
| McPherson | 8,937 | 66.76% | 4,218 | 31.51% | 107 | 0.80% | 70 | 0.52% | 54 | 0.40% | 4,719 | 35.25% | 13,386 |
| Meade | 1,540 | 79.75% | 357 | 18.49% | 14 | 0.73% | 12 | 0.62% | 8 | 0.41% | 1,183 | 61.26% | 1,931 |
| Miami | 9,382 | 61.01% | 5,742 | 37.34% | 116 | 0.75% | 68 | 0.44% | 69 | 0.45% | 3,640 | 23.67% | 15,377 |
| Mitchell | 2,440 | 76.18% | 701 | 21.89% | 34 | 1.06% | 16 | 0.50% | 12 | 0.37% | 1,739 | 54.29% | 3,203 |
| Montgomery | 9,309 | 66.94% | 4,338 | 31.19% | 145 | 1.04% | 70 | 0.50% | 45 | 0.32% | 4,971 | 35.75% | 13,907 |
| Morris | 1,875 | 66.00% | 907 | 31.93% | 28 | 0.99% | 16 | 0.56% | 15 | 0.53% | 968 | 34.07% | 2,841 |
| Morton | 1,153 | 82.24% | 229 | 16.33% | 8 | 0.57% | 11 | 0.78% | 1 | 0.07% | 924 | 65.91% | 1,402 |
| Nemaha | 3,817 | 71.23% | 1,432 | 26.72% | 67 | 1.25% | 20 | 0.37% | 23 | 0.43% | 2,385 | 44.51% | 5,359 |
| Neosho | 4,473 | 62.19% | 2,563 | 35.64% | 95 | 1.32% | 31 | 0.43% | 30 | 0.42% | 1,910 | 26.55% | 7,192 |
| Ness | 1,207 | 79.15% | 289 | 18.95% | 21 | 1.38% | 5 | 0.33% | 3 | 0.20% | 918 | 60.20% | 1,525 |
| Norton | 1,878 | 77.76% | 497 | 20.58% | 23 | 0.95% | 13 | 0.54% | 4 | 0.17% | 1,381 | 57.18% | 2,415 |
| Osage | 4,820 | 63.89% | 2,534 | 33.59% | 96 | 1.27% | 59 | 0.78% | 35 | 0.46% | 2,286 | 30.30% | 7,544 |
| Osborne | 1,490 | 77.20% | 403 | 20.88% | 26 | 1.35% | 7 | 0.36% | 4 | 0.21% | 1,087 | 56.32% | 1,930 |
| Ottawa | 2,323 | 75.28% | 704 | 22.81% | 28 | 0.91% | 18 | 0.58% | 13 | 0.42% | 1,619 | 52.47% | 3,086 |
| Pawnee | 1,946 | 67.59% | 882 | 30.64% | 39 | 1.35% | 6 | 0.21% | 6 | 0.21% | 1,064 | 36.95% | 2,879 |
| Phillips | 2,105 | 78.93% | 525 | 19.69% | 29 | 1.09% | 5 | 0.19% | 3 | 0.11% | 1,580 | 59.24% | 2,667 |
| Pottawatomie | 6,929 | 70.15% | 2,599 | 26.31% | 79 | 0.80% | 50 | 0.51% | 220 | 2.22% | 4,330 | 43.84% | 9,877 |
| Pratt | 2,822 | 67.35% | 1,294 | 30.88% | 40 | 0.95% | 24 | 0.57% | 10 | 0.24% | 1,528 | 36.47% | 4,190 |
| Rawlins | 1,247 | 80.50% | 273 | 17.62% | 14 | 0.90% | 8 | 0.52% | 7 | 0.45% | 974 | 62.88% | 1,549 |
| Reno | 16,112 | 60.57% | 9,916 | 37.28% | 232 | 0.87% | 136 | 0.51% | 206 | 0.78% | 6,196 | 23.29% | 26,602 |
| Republic | 1,978 | 74.05% | 640 | 23.96% | 27 | 1.01% | 15 | 0.56% | 11 | 0.41% | 1,338 | 50.09% | 2,671 |
| Rice | 2,780 | 69.14% | 1,163 | 28.92% | 44 | 1.09% | 23 | 0.57% | 11 | 0.27% | 1,617 | 40.22% | 4,021 |
| Riley | 12,111 | 52.43% | 10,495 | 45.43% | 186 | 0.81% | 148 | 0.64% | 160 | 0.70% | 1,616 | 7.00% | 23,100 |
| Rooks | 2,068 | 79.91% | 468 | 18.08% | 31 | 1.20% | 11 | 0.43% | 10 | 0.39% | 1,600 | 61.83% | 2,588 |
| Rush | 1,225 | 68.78% | 504 | 28.30% | 29 | 1.63% | 12 | 0.67% | 11 | 0.62% | 721 | 40.48% | 1,781 |
| Russell | 2,509 | 76.19% | 736 | 22.35% | 23 | 0.70% | 14 | 0.43% | 11 | 0.33% | 1,773 | 53.84% | 3,293 |
| Saline | 14,165 | 62.16% | 8,186 | 35.92% | 187 | 0.82% | 184 | 0.81% | 66 | 0.29% | 5,979 | 26.24% | 22,788 |
| Scott | 1,823 | 83.66% | 321 | 14.73% | 19 | 0.87% | 7 | 0.32% | 9 | 0.41% | 1,502 | 68.93% | 2,179 |
| Sedgwick | 106,849 | 55.15% | 82,337 | 42.50% | 1,589 | 0.82% | 1,231 | 0.64% | 1,724 | 0.89% | 24,512 | 12.65% | 193,730 |
| Seward | 3,791 | 71.05% | 1,493 | 27.98% | 15 | 0.28% | 24 | 0.45% | 13 | 0.24% | 2,298 | 43.07% | 5,336 |
| Shawnee | 41,476 | 49.05% | 41,235 | 48.77% | 823 | 0.97% | 418 | 0.49% | 598 | 0.70% | 241 | 0.28% | 84,550 |
| Sheridan | 1,108 | 80.52% | 254 | 18.46% | 11 | 0.80% | 2 | 0.15% | 1 | 0.07% | 854 | 62.06% | 1,376 |
| Sherman | 1,959 | 72.45% | 688 | 25.44% | 30 | 1.11% | 16 | 0.59% | 11 | 0.41% | 1,271 | 47.01% | 2,704 |
| Smith | 1,719 | 77.78% | 446 | 20.18% | 23 | 1.04% | 10 | 0.45% | 12 | 0.54% | 1,273 | 57.60% | 2,210 |
| Stafford | 1,495 | 72.08% | 542 | 26.13% | 21 | 1.01% | 8 | 0.39% | 8 | 0.39% | 953 | 45.95% | 2,074 |
| Stanton | 628 | 75.94% | 188 | 22.73% | 6 | 0.73% | 3 | 0.36% | 2 | 0.24% | 440 | 53.21% | 827 |
| Stevens | 1,815 | 85.33% | 283 | 13.31% | 9 | 0.42% | 11 | 0.52% | 9 | 0.42% | 1,532 | 72.02% | 2,127 |
| Sumner | 6,737 | 65.17% | 3,353 | 32.44% | 124 | 1.20% | 74 | 0.72% | 49 | 0.47% | 3,384 | 32.73% | 10,337 |
| Thomas | 2,837 | 77.24% | 787 | 21.43% | 29 | 0.79% | 9 | 0.25% | 11 | 0.30% | 2,050 | 55.81% | 3,673 |
| Trego | 1,225 | 73.31% | 420 | 25.13% | 18 | 1.08% | 2 | 0.12% | 6 | 0.36% | 805 | 48.18% | 1,671 |
| Wabaunsee | 2,395 | 68.02% | 1,036 | 29.42% | 36 | 1.02% | 14 | 0.40% | 40 | 1.14% | 1,359 | 38.60% | 3,521 |
| Wallace | 690 | 85.82% | 96 | 11.94% | 8 | 1.00% | 5 | 0.62% | 5 | 0.62% | 594 | 73.88% | 804 |
| Washington | 2,248 | 75.44% | 659 | 22.11% | 30 | 1.01% | 20 | 0.67% | 23 | 0.77% | 1,589 | 53.33% | 2,980 |
| Wichita | 840 | 82.43% | 163 | 16.00% | 8 | 0.79% | 3 | 0.29% | 5 | 0.49% | 677 | 66.43% | 1,019 |
| Wilson | 2,850 | 69.16% | 1,170 | 28.39% | 49 | 1.19% | 20 | 0.49% | 32 | 0.78% | 1,680 | 40.77% | 4,121 |
| Woodson | 1,055 | 65.98% | 512 | 32.02% | 21 | 1.31% | 6 | 0.38% | 5 | 0.31% | 543 | 33.96% | 1,599 |
| Wyandotte | 16,506 | 28.75% | 39,865 | 69.44% | 409 | 0.71% | 190 | 0.33% | 439 | 0.76% | -23,359 | -40.69% | 57,409 |
| Totals | 699,655 | 56.48% | 514,765 | 41.55% | 10,527 | 0.85% | 6,706 | 0.54% | 7,220 | 0.58% | 184,890 | 14.93% | 1,238,873 |

| Democratic Hold Gain from Republican | Republican Hold |
Counties that flipped from Republican to Democratic
Results by congressional district
McCain carried three of the state’s four congressional districts.
| District | McCain | Obama | Representative |
|---|---|---|---|
| 1st | 68.60% | 29.61% | Jerry Moran |
| 2nd | 54.87% | 43.20% | Nancy Boyda (110th Congress) |
| Lynn Jenkins (111th Congress) | |||
| 3rd | 48.01% | 50.59% | Dennis Moore |
| 4th | 58.38% | 39.72% | Todd Tiahrt |
Electors
Technically the voters of Kansas cast their ballots for electors: representatives to the Electoral College. Kansas is allocated 6 electors because it has 4 congressional districts and 2 senators. All candidates who appear on the ballot or qualify to receive write-in votes must submit a list of 6 electors, who pledge to vote for their candidate and his or her running mate. Whoever wins the majority of votes in the state is awarded all 6 electoral votes. Their chosen electors then vote for president and vice president. Although electors are pledged to their candidate and running mate, they are not obligated to vote for them.[20] An elector who votes for someone other than his or her candidate is known as a faithless elector.
The electors of each state and the District of Columbia met on December 15, 2008, to cast their votes for president and vice president. The Electoral College itself never meets as one body. Instead the electors from each state and the District of Columbia met in their respective capitols.
The following were the members of the Electoral College from the state. All 6 were pledged to John McCain and Sarah Palin:[21]
- Tom Arpke
- Jeff Colyer
- David Kensinger
- Kris Kobach
- Mike Pompeo
- Helen Van Etten
See also
References
- ^ "D.C.'s Political Report: The complete source for campaign summaries". January 1, 2009. Archived from the original on January 1, 2009. Retrieved August 23, 2021.
- ^ "Presidential". May 5, 2015. Archived from the original on May 5, 2015. Retrieved August 23, 2021.
- ^ "Vote 2008 - The Takeaway - Track the Electoral College vote predictions". April 22, 2009. Archived from the original on April 22, 2009. Retrieved August 23, 2021.
- ^ "Electoral-vote.com: President, Senate, House Updated Daily". electoral-vote.com. Retrieved August 23, 2021.
- ^ a b c d Based on Takeaway
- ^ "POLITICO's 2008 Swing State Map - POLITICO.com". www.politico.com. Retrieved September 22, 2016.
- ^ "RealClearPolitics - Electoral Map". Archived from the original on June 5, 2008.
- ^ "CQ Presidential Election Maps, 2008". CQ Politics. Archived from the original on June 14, 2009. Retrieved December 20, 2009.
- ^ Nagourney, Adam; Zeleny, Jeff; Carter, Shan (November 4, 2008). "The Electoral Map: Key States". The New York Times. Retrieved May 26, 2010.
- ^ "October – 2008 – CNN Political Ticker - CNN.com Blogs". CNN. October 31, 2008. Archived from the original on June 19, 2010. Retrieved May 26, 2010.
- ^ "Winning The Electoral College". Fox News. April 27, 2010.
- ^ "roadto270". hosted.ap.org. Retrieved September 22, 2016.
- ^ "Election 2008: Electoral College Update - Rasmussen Reports". www.rasmussenreports.com. Retrieved September 22, 2016.
- ^ Election 2008 Polls - Dave Leip's Atlas of U.S. Presidential Elections
- ^ "Presidential Campaign Finance". Archived from the original on March 24, 2009. Retrieved August 20, 2009.
- ^ "Map: Campaign Ad Spending - Election Center 2008 from CNN.com". CNN. Retrieved May 26, 2010.
- ^ "Map: Campaign Candidate Visits - Election Center 2008 from CNN.com". CNN. Retrieved May 26, 2010.
- ^ "Atlas of U.S. Presidential Elections". Retrieved January 13, 2013.
- ^ "KS US President Race, November 04, 2008". Our Campaigns.
- ^ "Electoral College". California Secretary of State. Archived from the original on October 30, 2008. Retrieved November 1, 2008.
- ^ Kansas Secretary of State - 2008 Presidential Electors
