
| ||||||||||||||||||||||||||||||||||||||||||||||||||||||||||||||||||||
All 183 seats in the National Council 92 seats needed for a majority | ||||||||||||||||||||||||||||||||||||||||||||||||||||||||||||||||||||
|---|---|---|---|---|---|---|---|---|---|---|---|---|---|---|---|---|---|---|---|---|---|---|---|---|---|---|---|---|---|---|---|---|---|---|---|---|---|---|---|---|---|---|---|---|---|---|---|---|---|---|---|---|---|---|---|---|---|---|---|---|---|---|---|---|---|---|---|---|
| Turnout | 85.98% ( | |||||||||||||||||||||||||||||||||||||||||||||||||||||||||||||||||||
| ||||||||||||||||||||||||||||||||||||||||||||||||||||||||||||||||||||
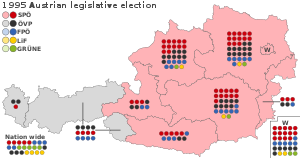 Results of the election, showing seats won by state and nationwide. States are shaded according to the first-place party. | ||||||||||||||||||||||||||||||||||||||||||||||||||||||||||||||||||||
| ||||||||||||||||||||||||||||||||||||||||||||||||||||||||||||||||||||


Parliamentary elections were held in Austria on 17 December 1995 to elect the 20th National Council, the lower house of Austria's bicameral parliament.[1] The snap election was called after the collapse of the grand coalition between the Social Democratic Party of Austria (SPÖ) and Austrian People's Party (ÖVP) due to a dispute regarding the national budget. The SPÖ made small gains primarily at the expense of minor parties, while the ÖVP remained stable. The grand coalition was subsequently renegotiated.
YouTube Encyclopedic
-
1/5Views:52 8249 2201 6499 307755
-
What is the difference between Directives, Regulations and Decisions?
-
Map of USA senators by party affiliation from 1789 to 2017
-
A Brief History of the EU
-
English 18 October 2017 - The Hindu Editorial News Paper Analysis [UPSC/ SSC/ IBPS] Current affairs
-
'European Citizenship: How does it (not) work?', presented by Engin Isin at Fudan University
Transcription
Contesting parties
The table below lists parties represented in the 19th National Council.
| Name | Ideology | Leader | 1994 result | |||
|---|---|---|---|---|---|---|
| Votes (%) | Seats | |||||
| SPÖ | Social Democratic Party of Austria Sozialdemokratische Partei Österreichs |
Social democracy |  Franz Vranitzky |
34.9% | 65 / 183
| |
| ÖVP | Austrian People's Party Österreichische Volkspartei |
Christian democracy |  Wolfgang Schüssel |
27.7% | 52 / 183
| |
| FPÖ | Freedom Party of Austria Freiheitliche Partei Österreichs |
Right-wing populism Euroscepticism |
 Jörg Haider |
22.5% | 42 / 183
| |
| GRÜNE | The Greens – The Green Alternative Die Grünen – Die Grüne Alternative |
Green politics |  Madeleine Petrovic |
7.3% | 13 / 183
| |
| LiF | Liberal Forum Liberales Forum |
Liberalism |  Heide Schmidt |
6.0% | 11 / 183
| |
Results
 | |||||
|---|---|---|---|---|---|
| Party | Votes | % | Seats | +/– | |
| Social Democratic Party of Austria | 1,843,474 | 38.06 | 71 | +6 | |
| Austrian People's Party | 1,370,510 | 28.29 | 52 | 0 | |
| Freedom Party of Austria | 1,060,377 | 21.89 | 41 | –1 | |
| Liberal Forum | 267,026 | 5.51 | 10 | –1 | |
| The Greens – The Green Alternative | 233,208 | 4.81 | 9 | –4 | |
| No – Civic Action Group against the Sale of Austria | 53,176 | 1.10 | 0 | 0 | |
| Communist Party of Austria | 13,938 | 0.29 | 0 | 0 | |
| Austrian Natural Law Party | 1,634 | 0.03 | 0 | 0 | |
| The Best Party | 830 | 0.02 | 0 | 0 | |
| Total | 4,844,173 | 100.00 | 183 | 0 | |
| Valid votes | 4,844,173 | 97.68 | |||
| Invalid/blank votes | 115,282 | 2.32 | |||
| Total votes | 4,959,455 | 100.00 | |||
| Registered voters/turnout | 5,768,099 | 85.98 | |||
| Source: Austrian Interior Ministry | |||||
Results by state
| State | SPÖ | ÖVP | FPÖ | LiF | Grüne | Others | |||
|---|---|---|---|---|---|---|---|---|---|
| 44.6 | 31.9 | 16.9 | 3.3 | 2.5 | 0.8 | ||||
| 40.8 | 18.5 | 32.7 | 3.6 | 3.5 | 0.9 | ||||
| 37.9 | 34.5 | 17.3 | 5.0 | 3.7 | 1.6 | ||||
| 38.1 | 29.5 | 21.6 | 4.4 | 5.1 | 1.3 | ||||
| 32.6 | 29.1 | 25.4 | 6.1 | 5.6 | 1.2 | ||||
| 39.7 | 29.5 | 21.2 | 4.2 | 4.0 | 1.4 | ||||
| 27.3 | 31.3 | 27.0 | 6.2 | 6.4 | 1.8 | ||||
| 22.9 | 34.1 | 27.4 | 7.1 | 7.3 | 1.2 | ||||
| 44.0 | 19.5 | 20.1 | 8.6 | 6.0 | 1.8 | ||||
| 38.1 | 28.3 | 21.9 | 5.5 | 4.8 | 1.4 | ||||
| Source: Austrian Interior Ministry | |||||||||
References
- ^ Dieter Nohlen & Philip Stöver (2010) Elections in Europe: A data handbook, p196 ISBN 978-3-8329-5609-7
| |||||||||||
| |||||||||||
This article about politics in Austria is a stub. You can help Wikipedia by expanding it. |