To install click the Add extension button. That's it.

The source code for the WIKI 2 extension is being checked by specialists of the Mozilla Foundation, Google, and Apple. You could also do it yourself at any point in time.

4,5
Kelly Slayton
Congratulations on this excellent venture… what a great idea!
Alexander Grigorievskiy
I use WIKI 2 every day and almost forgot how the original Wikipedia looks like.
Live Statistics
English Articles
Improved in 24 Hours
Added in 24 Hours
Languages
Recent
Show all languages
What we do. Every page goes through several hundred of perfecting techniques; in live mode. Quite the same Wikipedia. Just better.
.
Leo
Newton
Brights
Milds

Yukon (electoral district)

From Wikipedia, the free encyclopedia

Yukon
Yukon electoral district
Federal electoral district
LegislatureHouse of Commons
MP


Brendan Hanley
Liberal
District created1952
First contested1953
Last contested2021
District webpageprofile, map
Demographics
Population (2013)[1]33,897
Electors (2015)25,264
Area (km²)[2]482,443
Pop. density (per km²)0.07
Census division(s)Yukon
Census subdivision(s)Whitehorse, Dawson City, Watson Lake, Haines Junction, Carmacks, Faro, Teslin, Mayo

Yukon is a federal electoral district covering the entire territory of Yukon, Canada. It has been represented in the House of Commons of Canada from 1902 to 1949 and since 1953.

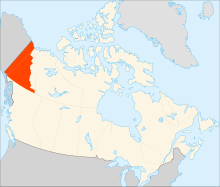
The city of Whitehorse comprises an overwhelmingly large portion of the electorate and thus elections are fought on a comparatively small area.

YouTube Encyclopedic

  • 1/3
    Views:
    26 072 013
    8 792
    366 797
  • Canada & The United States's Bizarre Border
  • How Canadian Elections Work: Federal Voting Process in Canada
  • Discover Canada Study Guide Audio (Timestamped Chapters, Official Citizenship Test, Captions)

Transcription

Canada and the United States share the longest, straightest, possibly boringest border in the world. But, look closer, and there's plenty of bizarreness to be found. While these sister nations get along fairly well, they both want to make it really clear whose side of the continent is whose. And they've done this by carving a 20-foot wide space along the border. All five and a half thousand miles of it. With the exception of the rare New England town that predates national borders or the odd airport that needed extending, this space is the no-touching-zone between the countries and they're super serious about keeping it clear. It matters not if the no-touching-zone runs through hundreds of miles of virtually uninhabited Alaskan / Yukon wilderness. Those border trees, will not stand. Which might make you think this must be the longest, straightest deforested place in the world, but it isn't. Deforested: yes, but straight? Not at all. Sure it looks straight and on a map, and the treaties establishing the line *say* it's straight... but in the real world the official border is 900 lines that zig-zags from the horizontal by as much as several hundred feet. How did this happen? Well, imagine you're back in North America in the 1800s -- The 49th parallel (one of those horizontal lines you see on a globe) has just been set as the national boundary and it's your job to make it real. You're handed a compass and a ball of string and told to carefully mark off the next 2/3rds of a continent. Don't mind that uncharted wilderness in the way: just keep the line straight. Yeah. Good luck. With that. The men who surveyed the land did the best they could and built over 900 monuments. They're in about as straight as you could expect a pre-GPS civilization to make, but it's not the kind of spherical / planar intersection that would bring a mathematician joy. Nonetheless these monuments define the border and the no-touching-zone plays connect-the-dots with them. Oh, and while there are about 900 markers along this section of the border, there are about 8,000 in total that define the shape of the nations. Despite this massive project Canada and the United States still have disputed territory. There is a series of islands in the Atlantic that the United States claims are part of Maine and Canada claims are part of New Brunswick. Canada, assuming the islands are hers built a lighthouse on one of them, and the United States, assuming the islands are hers pretends the lighthouse doesn't exist. It's not a huge problem as the argument is mostly over tourists who want to see puffins and fishermen who want to catch lobsters, but let's hope the disagreement gets resolved before someone finds oil under that lighthouse. Even the non-disputed territory has a few notably weird spots: such as this tick of the border upward into Canada. Zoom in and it gets stranger as the border isn't over solid land but runs through a lake to cut off a bit of Canada before diving back down to the US. This spot is home to about 100 Americans and is a perfect example of how border irregularities are born: Back in 1783 when the victorious Americans were negotiating with the British who controlled what would one day be Canada, they needed a map, and this map was the best available at the time. While the East Coast looks pretty good, the wester it goes the sparser it gets. Under negotiation was the edge of what would one day be Minnesota and Manitoba. But unfortunately, that area was hidden underneath an inset on the map, so the Americans and British were bordering blind. Seriously. They guessed that the border should start from the northwestern part of this lake and go in a horizontal line until it crossed the Mississippi... somewhere. But somewhere, turned out to be nowhere as the mighty Mississippi stops short of that line, which left the border vague until 35 years later when a second round of negotiations established the aforementioned 49th parallel. But there was still a problem as the lake mentioned earlier was both higher, and less circular than first though, putting its northwesterly point here so the existing border had to jump up to meet it and then drop straight down to the 49th, awkwardly cutting off a bit of Canada, before heading west across the remainder of the continent. Turns out you just can't draw a straight(-ish) line for hundreds of miles without causing a few more problems. One of which was luckily spotted in advance: Vancouver Island, which the 49th would have sliced through, but both sides agreed that would be dumb so the border swoops around the island. However, next door to Vancouver Island is Point Roberts which went unnoticed as so today the border blithey cuts across. It's a nice little town, home to over 1,000 Americans, but has only a primary school so its older kids have to cross international borders four times a day to go to school in their own state. In a pleasing symetry, the East cost has the exact opposite situation with a Canadian Island whose only land route is a bridge to the United States. And these two aren't the only places where each country contains a bit of the other: there are several more, easily spotted in sattelite photos by the no-touching zone. Regardless of if the land in question is just an uninhabited strip, in the middle of a lake, in the middle of nowhere, the border between these sister nations must remain clearly marked.

Demographics

Population, 2013 36,526[1]
Electors 21,196
Area (km2) 482,443 km2
Population density (people per km2) 0.06/km2
According to the 2016 Canadian census
  • Twenty most common mother tongue languages (2016) : 83.4% English, 4.5% French, 2.3% Tagalog, 2.2% German, 0.6% Cantonese, 0.6% Northern Tutchone, 0.5% Spanish, 0.5% Kaska, 0.3% Dutch, 0.3% Mandarin, 0.3% Japanese, 0.3% Panjabi, 0.2% Cebuano, 0.2% Gwi'chin, 0.2% Russian, 0.2% Southern Tutchone, 0.2% Polish, 0.2% Tlingit, 0.2% Czech[3]

Geography

The district includes all of Yukon.

History

The electoral district was created in 1901 with the obligation that Yukon send a Member of Parliament to the House of Commons by January 1, 1903. James Hamilton Ross, the third Commissioner of Yukon, was elected on December 2, 1902.

The riding was abolished in 1947, and the riding of Yukon—Mackenzie River was created including a portion of the Northwest Territories. In 1952, Yukon-Mackenzie River was abolished, and the riding of Yukon was recreated.

This riding did not change as a result of the 2012 redistribution.

Riding associations

Riding associations are the local branches of political parties:

Party Association name CEO HQ address HQ city
Conservative Yukon Conservative Association Pat McInroy 607 Ray Street Whitehorse
Green Yukon Federal Green Party Association Gerald Haase Post Office Box 2207 Whitehorse
Liberal Yukon Liberal Association Blake Rogers 108 Elliott Street Whitehorse
New Democratic Yukon Federal New Democratic Party Riding Association Daniel R. Bader PO Box 31516 Whitehorse

Members of Parliament

This riding has elected the following members of Parliament:

Parliament Years Member Party
Yukon
9th  1902–1904     James Hamilton Ross Liberal
10th  1904–1908     Alfred Thompson Conservative
11th  1908–1911     Frederick Tennyson Congdon Liberal
12th  1911–1917     Alfred Thompson Conservative
13th  1917–1921     Government (Unionist)
14th  1921–1925     George Black Conservative
15th  1925–1926
16th  1926–1930
17th  1930–1935
18th  1935–1940     Martha Black Independent Conservative
19th  1940–1945     George Black National Government
20th  1945–1949     Progressive Conservative
Riding dissolved into Yukon—Mackenzie River
Riding re-created from Yukon—Mackenzie River
22nd  1953–1957     James Aubrey Simmons Liberal
23rd  1957–1957
 1957–1958     Erik Nielsen Progressive Conservative
24th  1958–1962
25th  1962–1963
26th  1963–1965
27th  1965–1968
28th  1968–1972
29th  1972–1974
30th  1974–1979
31st  1979–1980
32nd  1980–1984
33rd  1984–1987
 1987–1988     Audrey McLaughlin New Democratic
34th  1988–1993
35th  1993–1997
36th  1997–2000 Louise Hardy
37th  2000–2004     Larry Bagnell Liberal
38th  2004–2006
39th  2006–2008
40th  2008–2011
41st  2011–2015     Ryan Leef Conservative
42nd  2015–2019     Larry Bagnell Liberal
43rd  2019–2021
44th  2021–present Brendan Hanley

Current member of Parliament

Yukon's current member of Parliament is Brendan Hanley, a member of the Liberal Party who was elected in 2021.

Election results

Yukon (1953–present)

Graph of election results in Yukon (since 1953, minor parties that never got 2% of the vote or didn't run consistently are omitted)


2021 Canadian federal election
Party Candidate Votes % ±% Expenditures
Liberal Brendan Hanley 6,471 33.35 -0.15
Conservative Barbara Dunlop 5,096 26.26 -6.44
New Democratic Lisa Vollans-Leduc 4,354 22.44 +0.44
Independent Jonas Jacot Smith 2,639 13.6
Green Lenore Morris 846 4.36 -6.14
Total valid votes 19,406
Total rejected ballots 142 0.73
Turnout 19,548 64.69
Eligible voters 30,217
Liberal hold Swing +3.1
Source: Elections Canada[4]
2019 Canadian federal election
Party Candidate Votes % ±% Expenditures
Liberal Larry Bagnell 7,034 33.5 -20.25 $54,266.95
Conservative Jonas Jacot Smith 6,881 32.7 +8.81 none listed
New Democratic Justin Lemphers 4,617 22.0 +2.37 $47,123.08
Green Lenore Morris 2,201 10.5 +7.67 $48,980.40
People's Joseph Zelezny 284 1.4 none listed
Total valid votes/expense limit 21,017 100.0 $108,816.25
Total rejected ballots 133
Turnout 21,150 73.2
Eligible voters 28,897
Liberal hold Swing -14.53
Source: Elections Canada[5][6]
2015 Canadian federal election
Party Candidate Votes % ±% Expenditures
Liberal Larry Bagnell 10,887 53.65 +20.70
Conservative Ryan Leef 4,928 24.29 -9.48
New Democratic Melissa Atkinson 3,943 19.43 +5.06
Green Frank de Jong 533 2.63 -16.28
Total valid votes/expense limit 20,291 100.0     $210,779.30
Total rejected ballots 94
Turnout 20,385
Eligible voters 26,283
Liberal gain from Conservative Swing +10.92
Source: Elections Canada[7][8]


2011 Canadian federal election
Party Candidate Votes % ±% Expenditures
Conservative Ryan Leef 5,422 33.77 +1.11 $78,970
Liberal Larry Bagnell 5,290 32.95 -12.85 $79,778
Green John Streicker 3,037 18.91 +6.08 $42,746
New Democratic Kevin Barr 2,308 14.37 +5.67 $28,631
Total valid votes/expense limit 16,057 100.0     $85,898
Total rejected ballots 67 0.42
Turnout 16,124 68.11
Eligible voters 23,673
Conservative gain from Liberal Swing +6.98
2008 Canadian federal election
Party Candidate Votes % ±% Expenditures
Liberal Larry Bagnell 6,715 45.80 -3.26 $56,745
Conservative Darrell Pasloski 4,788 32.66 +9.12 $68,782
Green John Streicker 1,881 12.83 +9.00 $14,609
New Democratic Ken Bolton 1,276 8.70 -14.85 $13,004
Total valid votes/expense limit 14,660 100.0     $82,727
Liberal hold Swing
2006 Canadian federal election
Party Candidate Votes % ±% Expenditures
Liberal Larry Bagnell 6,847 48.52 +2.84 $42,606
New Democratic Pam Boyde 3,366 23.85 -1.82 $35,493
Conservative Susan Greetham 3,341 23.67 +2.78 $17,992
Green Philippe LeBlond 559 3.96 -0.59 $20
Total valid votes/expense limit 14,113 100.0     $76,176
Liberal hold Swing +2.33
2004 Canadian federal election
Party Candidate Votes % ±% Expenditures
Liberal Larry Bagnell 5,724 45.68 +13.21 $43,323
New Democratic Pam Boyde 3,216 25.67 -6.27 $42,221
Conservative James Hartle 2,618 20.89 -14.27 $19,750
Green Philippe LeBlond 571 4.55 $1,463
Marijuana Sean Davey 299 2.38
Christian Heritage Geoffrey Capp 100 0.79 +0.39
Total valid votes 12,528 100.0  
Total rejected ballots 50 0.40
Turnout 12,578 61.82
Liberal hold Swing +9.74
Conservative change is from the combination of Canadian Alliance and Progressive Conservative votes.
2000 Canadian federal election
Party Candidate Votes % ±% Expenditures
Liberal Larry Bagnell 4,293 32.47 +10.52 $48,252
New Democratic Louise Hardy 4,223 31.94 +3.01 $65,576
Alliance Jim Kenyon 3,659 27.67 +2.42 $31,121
Progressive Conservative Don Cox 991 7.49 -6.45 $6,316
No Affiliation Geoffrey Capp 53 0.40 -0.58 $1,044
Total valid votes 13,219 100.0  
Total rejected ballots 53 0.40
Turnout 13,272 63.50
Liberal gain from New Democratic Swing +3.76
Geoffrey Capp was a Christian Heritage candidate, but the party lacked registered status. Canadian Alliance change is based on the former Reform Party.
1997 Canadian federal election
Party Candidate Votes % ±% Expenditures
New Democratic Louise Hardy 4,002 28.93 -14.41 $52,148
Reform Ken Gabb 3,493 25.25 +12.14 $18,143
Liberal Shirley Adamson 3,036 21.95 -1.34 $43,661
Progressive Conservative Ken McKinnon 1,928 13.94 -3.85 $24,269
Independent Don Branigan 1,234 8.92 $8,160
Christian Heritage Geoffrey Capp 136 0.98 +0.56 $1,267
Total valid votes 13,829 100.0  
Total rejected ballots 86 0.62
Turnout 13,915 69.81
New Democratic hold Swing -13.28
Independent candidate Don Branigan lost 14.37 percentage points from his 1993 performance running as a Liberal.
1993 Canadian federal election
Party Candidate Votes % ±%
New Democratic Audrey McLaughlin 6,252 43.34 -8.08
Liberal Don Branigan 3,359 23.29 +11.98
Progressive Conservative Al Kapty 2,566 17.79 -17.49
Reform A.B. Short Thompkins 1,891 13.11
National Robert L. Olson 296 2.05
Christian Heritage Geoffrey Capp 61 0.42 -1.57
Total valid votes 14,425 100.0  
New Democratic hold Swing -10.03
1988 Canadian federal election
Party Candidate Votes % ±%
New Democratic Audrey McLaughlin 6,594 51.42 +16.22
Progressive Conservative Charlie Friday 4,524 35.28 +8.00
Liberal Joe Jack 1,450 11.31 -21.11
Christian Heritage Jacob de Raadt 255 1.99
Total valid votes 13,823 100.0  
New Democratic hold Swing +4.11
Canadian federal by-election, 20 July 1987
Party Candidate Votes % ±%
New Democratic Audrey McLaughlin 3,273 35.20 +19.10
Liberal Don Branigan 3,014 32.42 +10.76
Progressive Conservative David Leverton 2,536 27.28 -29.52
Independent Fred Marshall 474 5.10
Total valid votes 9,297 100.0  
New Democratic gain from Progressive Conservative Swing +4.17
1984 Canadian federal election
Party Candidate Votes % ±%
Progressive Conservative Erik Nielsen 6,648 56.80 +16.20
Liberal Ron Veale 2,535 21.66 -17.90
New Democratic Sibyl Frei 1,884 16.10 -3.74
Libertarian Keith Dye 511 4.37
Rhinoceros Douglas R. Gibb 126 1.08
Total valid votes 11,704 100.0  
Progressive Conservative hold Swing +17.05
1980 Canadian federal election
Party Candidate Votes % ±%
Progressive Conservative Erik Nielsen 3,926 40.60 +0.01
Liberal Ione J. Christensen 3,825 39.56 +3.20
New Democratic Jim McCullough 1,918 19.84 -3.22
Total valid votes 9,669 100.0  
Progressive Conservative hold Swing -1.60
1979 Canadian federal election
Party Candidate Votes % ±%
Progressive Conservative Erik Nielsen 4,538 40.59 -6.47
Liberal Allen R. Lueck 4,065 36.36 +2.88
New Democratic Joe Jack 2,578 23.06 +3.60
Total valid votes 11,181 100.0  
Progressive Conservative hold Swing -4.68
1974 Canadian federal election
Party Candidate Votes % ±%
Progressive Conservative Erik Nielsen 3,913 47.06 -5.98
Liberal Paul S. White 2,784 33.48 +1.24
New Democratic Tony Penikett 1,618 19.46 +7.82
Total valid votes 8,315 100.0  
Progressive Conservative hold Swing -3.61
1972 Canadian federal election
Party Candidate Votes % ±%
Progressive Conservative Erik Nielsen 4,332 53.04 +5.07
Liberal Don Branigan 2,633 32.24 -14.78
New Democratic William Harvey Kent 951 11.64 +6.63
Independent Rainer Giannelia 252 3.09
Total valid votes 8,168 100.0  
Progressive Conservative hold Swing +9.92
1968 Canadian federal election
Party Candidate Votes % ±%
Progressive Conservative Erik Nielsen 3,110 47.97 -7.22
Liberal Chris Findlay 3,048 47.02 +2.21
New Democratic Robert A. McLaren 325 5.01
Total valid votes 8,168 100.0  
Progressive Conservative hold Swing -4.72
1965 Canadian federal election
Party Candidate Votes % ±%
Progressive Conservative Erik Nielsen 3,136 55.19 +5.57
Liberal Ray McKamey 2,546 44.81 +3.78
Total valid votes 5,682 100.0  
Progressive Conservative hold Swing +0.90
1963 Canadian federal election
Party Candidate Votes % ±%
Progressive Conservative Erik Nielsen 2,969 49.62 -5.33
Liberal Victor Wylie 2,455 41.03 -4.02
Social Credit Ray Wilson 560 9.36
Total valid votes 5,984 100.0  
Progressive Conservative hold Swing -0.66
1962 Canadian federal election
Party Candidate Votes % ±%
Progressive Conservative Erik Nielsen 3,250 54.95 +0.47
Liberal Victor Wylie 2,664 45.05 +1.79
Total valid votes 5,914 100.0  
Progressive Conservative hold Swing -0.66
1958 Canadian federal election
Party Candidate Votes % ±%
Progressive Conservative Erik Nielsen 2,947 54.48 +3.09
Liberal James Aubrey Simmons 2,340 43.26 -5.35
Independent Conservative John Victor Watt 122 2.26
Total valid votes 5,409 100.0  
Progressive Conservative hold Swing +4.22
Canadian federal by-election, 16 December 1957
Party Candidate Votes % ±%
Progressive Conservative Erik Nielsen 2,365 51.39 +2.06
Liberal James Aubrey Simmons 2,237 48.61 -2.06
Total valid votes 4,602 100.0  
Progressive Conservative gain from Liberal Swing +2.06
This by-election was called after the general election results were voided due to irregularities.
1957 Canadian federal election
Party Candidate Votes % ±%
Liberal James Aubrey Simmons 2,422 50.67 -7.14
Progressive Conservative Erik Nielsen 2,358 49.33 +33.66
Total valid votes 5,409 100.0  
Liberal hold Swing -20.40
1953 Canadian federal election
Party Candidate Votes %
Liberal James Aubrey Simmons 2,176 57.81
Social Credit Richard Gordon Lee 998 26.51
Progressive Conservative George Black 590 15.67
Total valid votes 5,409 100.0  
This riding was re-created from the riding of Yukon—Mackenzie River, where James Aubrey Simmons was the incumbent.

Yukon (1902–1947)

Graph of election results in Yukon (1902–1947, minor parties that never got 2% of the vote or didn't run consistently are omitted)
1945 Canadian federal election
Party Candidate Votes % ±%
Progressive Conservative George Black 849 41.19 -12.38
Labor–Progressive Tom McEwen 687 33.33
Co-operative Commonwealth Clive Hunter Cunningham 584 28.34
Total valid votes 2,061 100.0  
Progressive Conservative hold Swing -22.86
Progressive Conservative change is based on the results of the National Government.
1940 Canadian federal election
Party Candidate Votes % ±%
National Government George Black 915 53.57 -2.04
Liberal Charles Reid 793 46.43 +2.07
Total valid votes 1,708 100.0  
National Government hold Swing -2.06
National Government changes are based on the results of the Independent Conservative candidate (George Black's wife).
1935 Canadian federal election
Party Candidate Votes % ±%
Independent Conservative Martha Louise Black 696 55.64 -4.63
Liberal John Patrick Smith 555 44.36 +4.66
Total valid votes 1,251 100.0  
Independent Conservative hold Swing -4.64
Independent Conservative changes are based on the results of the Conservative candidate (Martha Black's husband)
1930 Canadian federal election
Party Candidate Votes % ±%
Conservative George Black 846 60.30 +4.35
Liberal William Edward Thompson 557 39.70 -4.35
Total valid votes 1,403 100.0  
Conservative hold Swing +4.35
1926 Canadian federal election
Party Candidate Votes % ±%
Conservative George Black 823 55.95 -3.41
Liberal Frederick Tennyson Congdon 648 44.05 +3.41
Total valid votes 1,471 100.0  
Conservative hold Swing -3.41
1925 Canadian federal election
Party Candidate Votes % ±%
Conservative George Black 742 59.36 +8.24
Liberal Robert Lowe 508 40.64 -6.94
Total valid votes 1,250 100.0  
Conservative hold Swing +7.59
1921 Canadian federal election
Party Candidate Votes % ±%
Conservative George Black 707 51.12 -3.15
Liberal Frederick Tennyson Congdon 658 47.58 +1.85
Independent George Pitts 18 1.30
Total valid votes 1,383 100.0  
Conservative hold Swing -2.50
1917 Canadian federal election
Party Candidate Votes % ±%
Government (Unionist) Alfred Thompson 959 54.27 -6.52
Opposition (Laurier Liberals) Frederick Tennyson Congdon 808 45.73 +6.52
Total valid votes 1,767 100.0  
Government (Unionist) hold Swing -6.52
1911 Canadian federal election
Party Candidate Votes % ±%
Conservative Alfred Thompson 1,285 60.79 +50.04
Liberal Frederick Tennyson Congdon 829 39.21 -1.03
Total valid votes 1,767 100.0  
Conservative gain from Liberal Swing +25.54
1908 Canadian federal election
Party Candidate Votes % ±%
Liberal Frederick Tennyson Congdon 992 40.24 -1.20
Unknown George Black 726 29.45
Unknown Robert Lowe 482 19.55
Conservative Joseph Andrew Clarke 265 10.75 -47.81
Total valid votes 2,465 100.0  
Liberal gain from Conservative Swing -15.32
1904 Canadian federal election
Party Candidate Votes % ±%
Conservative Alfred Thompson 2,113 58.56 +17.39
Liberal Frederick Tennyson Congdon 1,495 41.44 -17.09
Total valid votes 3,608 100.0  
Conservative gain from Liberal Swing +17.24
Canadian federal by-election, 2 December 1902
Party Candidate Votes %
Liberal James H. Ross 2,971 58.83
Conservative Joseph Andrew Clarke 2,079 41.17
Total valid votes 5,050 100.0  

See also

References

  • "Yukon (electoral district) (Code 60001) Census Profile". 2011 census. Government of Canada - Statistics Canada. Retrieved March 3, 2011.
  • Riding history for Yukon (1902–1947) from the Library of Parliament
  • Riding history for Yukon (1952–present) from the Library of Parliament
  • Expenditures – 2004
  • Expenditures – 2000
  • Expenditures – 1997

Notes

  1. ^ a b Yukon Bureau of Statistics Population Report 2013
  2. ^ Statistics Canada: 2012
  3. ^ "Data Table". www12.statcan.gc.ca. 2016. Retrieved July 21, 2021.
  4. ^ "Election Night Results". Elections Canada. Retrieved October 25, 2021.
  5. ^ "List of confirmed candidates". Elections Canada. Retrieved October 4, 2019.
  6. ^ "Election Night Results". Elections Canada. Retrieved November 3, 2019.
  7. ^ "Yukon - October 19, 2015 Official Voting Results". Elections Canada. Retrieved April 24, 2017.
  8. ^ Elections Canada – Final Candidates Election Expenses Limits

External links

This page was last edited on 14 April 2024, at 06:53
Basis of this page is in Wikipedia. Text is available under the CC BY-SA 3.0 Unported License. Non-text media are available under their specified licenses. Wikipedia® is a registered trademark of the Wikimedia Foundation, Inc. WIKI 2 is an independent company and has no affiliation with Wikimedia Foundation.