
Mineral County | |
|---|---|
 Welcome Sign at Historic Savenac Tree Nursery | |
 Location within the U.S. state of Montana | |
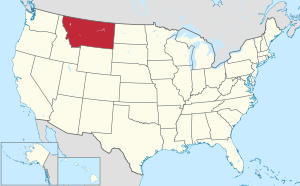 Montana's location within the U.S. | |
| Coordinates: 47°09′N 114°59′W / 47.15°N 114.98°W | |
| Country | |
| State | |
| Founded | 1914 |
| Seat | Superior |
| Largest town | Superior |
| Area | |
| • Total | 1,223 sq mi (3,170 km2) |
| • Land | 1,219 sq mi (3,160 km2) |
| • Water | 3.8 sq mi (10 km2) 0.3% |
| Population (2020) | |
| • Total | 4,535 |
| • Estimate (2022) | 5,058 |
| • Density | 3.7/sq mi (1.4/km2) |
| Time zone | UTC−7 (Mountain) |
| • Summer (DST) | UTC−6 (MDT) |
| Congressional district | 1st |
| Website | www |
| |
Mineral County is a county located in the U.S. state of Montana. As of the 2020 census, the population was 4,535.[1] Its county seat is Superior.[2]
YouTube Encyclopedic
-
1/2Views:873889
-
Panoramic Video from Montana's Oregon Peak in Mineral County
-
Mineral County Fair Montana 2011 Faces
Transcription
Geography
According to the United States Census Bureau, the county has a total area of 1,223 square miles (3,170 km2), of which 1,219 square miles (3,160 km2) is land and 3.8 square miles (9.8 km2) (0.3%) is water.[3]
Major highways
Adjacent counties
- Sanders County - north
- Missoula County - east
- Clearwater County, Idaho - southwest/Pacific Time Border
- Shoshone County, Idaho - northwest/Pacific Time Border
National protected area
- Lolo National Forest (part)
Politics
Mineral County has voted for the Republican Party candidate in all national elections since 2000. Before that, its voting was more balanced.
| Year | Republican | Democratic | Third party | |||
|---|---|---|---|---|---|---|
| No. | % | No. | % | No. | % | |
| 2020 | 1,828 | 71.32% | 686 | 26.77% | 49 | 1.91% |
| 2016 | 1,330 | 66.10% | 519 | 25.80% | 163 | 8.10% |
| 2012 | 1,216 | 60.17% | 700 | 34.64% | 105 | 5.20% |
| 2008 | 1,053 | 52.73% | 845 | 42.31% | 99 | 4.96% |
| 2004 | 1,242 | 67.61% | 542 | 29.50% | 53 | 2.89% |
| 2000 | 1,078 | 65.77% | 382 | 23.31% | 179 | 10.92% |
| 1996 | 549 | 33.99% | 658 | 40.74% | 408 | 25.26% |
| 1992 | 403 | 24.65% | 664 | 40.61% | 568 | 34.74% |
| 1988 | 616 | 43.14% | 789 | 55.25% | 23 | 1.61% |
| 1984 | 943 | 55.34% | 718 | 42.14% | 43 | 2.52% |
| 1980 | 800 | 48.28% | 660 | 39.83% | 197 | 11.89% |
| 1976 | 679 | 44.85% | 819 | 54.10% | 16 | 1.06% |
| 1972 | 706 | 49.75% | 659 | 46.44% | 54 | 3.81% |
| 1968 | 483 | 41.32% | 576 | 49.27% | 110 | 9.41% |
| 1964 | 368 | 28.89% | 901 | 70.72% | 5 | 0.39% |
| 1960 | 549 | 44.27% | 686 | 55.32% | 5 | 0.40% |
| 1956 | 606 | 52.33% | 552 | 47.67% | 0 | 0.00% |
| 1952 | 553 | 52.47% | 491 | 46.58% | 10 | 0.95% |
| 1948 | 338 | 39.30% | 475 | 55.23% | 47 | 5.47% |
| 1944 | 380 | 47.98% | 401 | 50.63% | 11 | 1.39% |
| 1940 | 402 | 37.64% | 645 | 60.39% | 21 | 1.97% |
| 1936 | 215 | 22.40% | 657 | 68.44% | 88 | 9.17% |
| 1932 | 260 | 27.23% | 578 | 60.52% | 117 | 12.25% |
| 1928 | 443 | 53.25% | 370 | 44.47% | 19 | 2.28% |
| 1924 | 223 | 21.61% | 123 | 11.92% | 686 | 66.47% |
| 1920 | 347 | 39.03% | 362 | 40.72% | 180 | 20.25% |
| 1916 | 251 | 20.47% | 781 | 63.70% | 194 | 15.82% |
Demographics
| Census | Pop. | Note | %± |
|---|---|---|---|
| 1920 | 2,327 | — | |
| 1930 | 1,626 | −30.1% | |
| 1940 | 2,135 | 31.3% | |
| 1950 | 2,081 | −2.5% | |
| 1960 | 3,037 | 45.9% | |
| 1970 | 2,958 | −2.6% | |
| 1980 | 3,675 | 24.2% | |
| 1990 | 3,315 | −9.8% | |
| 2000 | 3,884 | 17.2% | |
| 2010 | 4,223 | 8.7% | |
| 2020 | 4,535 | 7.4% | |
| 2022 (est.) | 5,058 | [5] | 11.5% |
| U.S. Decennial Census[6] 1790–1960,[7] 1900–1990,[8] 1990–2000,[9] 2010–2020[1] | |||
2020 census
As of the 2020 census, there were 4,535 people living in the county.[citation needed]
2010 census
As of the 2010 census, there were 4,223 people, 1,911 households, and 1,229 families in the county. The population density was 3.5 inhabitants per square mile (1.4 inhabitants/km2). There were 2,446 housing units at an average density of 2.0 units per square mile (0.77 units/km2). The racial makeup of the county was 94.9% white, 1.5% American Indian, 0.7% Asian, 0.3% black or African American, 0.2% from other races, and 2.4% from two or more races. Those of Hispanic or Latino origin made up 1.9% of the population. In terms of ancestry, 30.9% were German, 16.9% were Irish, 15.4% were English, and 3.0% were American.
Of the 1,911 households, 21.9% had children under the age of 18 living with them, 52.4% were married couples living together, 7.3% had a female householder with no husband present, 35.7% were non-families, and 29.7% of all households were made up of individuals. The average household size was 2.20 and the average family size was 2.69. The median age was 49.8 years.
The median income for a household in the county was $37,256 and the median income for a family was $44,271. Males had a median income of $35,536 versus $20,370 for females. The per capita income for the county was $19,209. About 12.7% of families and 19.0% of the population were below the poverty line, including 36.0% of those under age 18 and 4.3% of those age 65 or over.
Communities
Towns
Census-designated places
Other unincorporated communities
Former communities
See also
- List of lakes in Mineral County, Montana
- List of mountains in Mineral County, Montana
- National Register of Historic Places listings in Mineral County, Montana
References
- ^ a b "State & County QuickFacts". United States Census Bureau. Retrieved May 8, 2023.
- ^ "Find a County". National Association of Counties. Retrieved June 7, 2011.
- ^ "2010 Census Gazetteer Files". US Census Bureau. August 22, 2012. Archived from the original on December 5, 2014. Retrieved November 29, 2014.
- ^ Leip, David. "Atlas of US Presidential Elections". uselectionatlas.org. Retrieved April 3, 2018.
- ^ "Annual Estimates of the Resident Population for Counties: April 1, 2020 to July 1, 2022". United States Census Bureau. Retrieved May 8, 2023.
- ^ "U.S. Decennial Census". United States Census Bureau. Retrieved November 29, 2014.
- ^ "Historical Census Browser". University of Virginia Library. Retrieved November 29, 2014.
- ^ "Population of Counties by Decennial Census: 1900 to 1990". United States Census Bureau. Retrieved November 29, 2014.
- ^ "Census 2000 PHC-T-4. Ranking Tables for Counties: 1990 and 2000" (PDF). United States Census Bureau. Archived (PDF) from the original on March 27, 2010. Retrieved November 29, 2014.
- ^ Boxax, Saltese MT Google Maps (accessed January 3, 2019)
- ^ Bryson MT Google Maps (accessed January 3, 2019)
- ^ Cabin City MT Google Maps (accessed January 3, 2019)
- ^ Drexel MT Google Maps (accessed January 3, 2019)
- ^ Henderson MT Google Maps (accessed January 3, 2019)
- ^ Keystone MT Google Maps (accessed January 3, 2019)
- ^ Lozeau MT Google Maps (accessed January 3, 2019)
- ^ Quartz MT Google Maps (accessed January 3, 2019)
- ^ Sonon MT Google Maps (accessed January 3, 2019)
- ^ Spring Gulch MT Google Maps (accessed January 3, 2019)
- ^ Tammany MT Google Maps (accessed January 3, 2019)
- ^ Westfall MT Google Maps (accessed January 3, 2019)
External links
Places adjacent to Mineral County, Montana | ||||||||||||||||
|---|---|---|---|---|---|---|---|---|---|---|---|---|---|---|---|---|
| ||||||||||||||||
Municipalities and communities of Mineral County, Montana, United States | ||
|---|---|---|
| Towns | 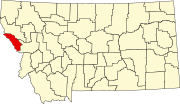 | |
| CDPs | ||
| Unincorporated communities | ||
| Ghost town | ||
| International | |
|---|---|
| National | |
47°09′N 114°59′W / 47.15°N 114.98°W