

| Function |
|---|
| x ↦ f (x) |
| History of the function concept |
| Examples of domains and codomains |
| Classes/properties |
| Constructions |
| Generalizations |


In mathematics, the graph of a function is the set of ordered pairs , where In the common case where and are real numbers, these pairs are Cartesian coordinates of points in a plane and often form a curve. The graphical representation of the graph of a function is also known as a plot.


In the case of functions of two variables – that is, functions whose domain consists of pairs –, the graph usually refers to the set of ordered triples where . This is a subset of three-dimensional space; for a continuous real-valued function of two real variables, its graph forms a surface, which can be visualized as a surface plot.


In science, engineering, technology, finance, and other areas, graphs are tools used for many purposes. In the simplest case one variable is plotted as a function of another, typically using rectangular axes; see Plot (graphics) for details.
A graph of a function is a special case of a relation. In the modern foundations of mathematics, and, typically, in set theory, a function is actually equal to its graph.[1] However, it is often useful to see functions as mappings,[2] which consist not only of the relation between input and output, but also which set is the domain, and which set is the codomain. For example, to say that a function is onto (surjective) or not the codomain should be taken into account. The graph of a function on its own does not determine the codomain. It is common[3] to use both terms function and graph of a function since even if considered the same object, they indicate viewing it from a different perspective.

YouTube Encyclopedic
-
1/5Views:1 123 22372 0143 210 7771 834 8771 757 101
-
Graphing a Basic Function
-
Intro to Graphing Functions and Function Tables
-
What is a function? | Functions and their graphs | Algebra II | Khan Academy
-
How To Graph Equations - Linear, Quadratic, Cubic, Radical, & Rational Functions
-
06 - What is a Function in Math? (Learn Function Definition, Domain & Range in Algebra)
Transcription
We're asked to graph the function f of x is equal to 5x minus 4. And we'll do it by really just sampling some points from the domain and seeing what value our function takes. And then we'll just graph those points. And then we'll connect the dots and see what forms. And there's other ways to do this, but this is the most simple or the most basic way. So if you look at this function right over here, it's actually defined for any real number that you stick there for x. So when we talk about sampling the domain, we can actually pick any real number for x. I'm actually going to pick real numbers that are fairly small in magnitude so that they're easy to graph. So I don't have to plot 8 billion on a number line over here. So let's draw ourselves some simple graph paper. Let's call that the x-axis. Let's call that the y-axis, or, actually, I should call it the y is equal to f of x. Whatever my x is, I input it into this function definition. It'll tell me what the function value is. It'll tell me f of x. And we're going to say y is equal to that. Now let's draw a little table here to try out some values. So let's say that this is x values and then this is f of x. And I can even say this is my y values, which are going to be equal to f of x. So let's start with-- I'm going to try negative 2, negative 1, 0, 1, and 2. So let's try negative 2 first. if x is equal to negative 2, what is f of x? Well, f of x is going to be 5 times negative 2 minus 4. So it's 5 times negative 2 minus 4, which is equal to negative 10 minus 4, which is negative 14. So let me plot that over here. And let me-- actually, maybe I'm going to have a slightly more scrunched up scale on the y-axis. And, actually, let me give myself some space so that I can go further down. Let me clear this. Give myself a little bit of space. So I have a feeling that I'll be using a lot of negative values since I just got all the way down to negative 14. So let me go further down here. And then let me mark off some increments over here. So let's say that this is negative 5. This is negative 10. And this is negative 15. And then this would be positive 5. And then this would be positive 10. So we have when x is negative 2, f of x is equal to negative 14, which is right about there. So that is negative 14. So that right over there is the point negative 2, negative 14, which we got right from that. Now, let's try another point. Let's try negative 1. When x is negative 1, f of x is 5 times negative 1 minus 4. 5 times negative 1 is negative 5, minus 4 is negative 9. So when x is negative1, f of x is negative 9. So negative 9 is right about here. So this is negative 9. So this is the point negative 1 negative 9 that is on the graph of f of x. And now let's try 0. When x is 0, f of x is going to be 5 times 0 minus 4. Well, that's just 0 minus 4, which is equal to negative 4. So when x is 0, f of x is equal to negative 4. So that's negative 4 right over there. And actually, our point is going to be sitting right over there. That is 0, negative 4. I wrote it to the left of the point. Let's keep going. Let's what happens when x is equal to 1. When x is equal to 1, f of x is equal to 5 times 1 minus 4. 5 times 1 is 5 , minus 4 is equal to 1. So we get to the point 1,1. So 1 and then 1 is right about there. So this is the point 1,1. And then let's just try one more. Let's see what happens when x is equal to 2. Then, f of x is 5 times 2 minus 4, which is 10 minus 4, which is equal to 6. So we have when x is equal to 2, f of x is equal to 6. So it's right about there. That's 6 right there. So this is the point 2, 6. So once again, these are just sample points from the domain. This isn't the entire domain. But it gives us enough points to kind of see the general structure of the graph. If we connect the dots, we see a line forming. So If we connect the dots-- let me draw. So if we connect the dots, it looks something like this. And my shaky hand makes it look a little bit curvy, but it should be an absolute straight line. If I had this on really good graph paper and I have had a ruler, you will see that this is a straight line. And it would keep going on and on and on. And I want to make it clear that we just sampled points from the domain. But we could take any point in the domain, which we already said is all real numbers. So if we took right over here. If we said 1.5 you could see. And if you graph 1.5, f of 1.5 it should sit on that line right over there. If you graphed f of negative 0.5-- so this is negative 0.5. If you graphed f of negative 0.5, it should sit on the line right over there. But we're done. We have graphed the function f of x is equal to 5x minus 4.
Definition
Given a function from a set X (the domain) to a set Y (the codomain), the graph of the function is the set[4]


Examples
Functions of one variable


The graph of the function defined by


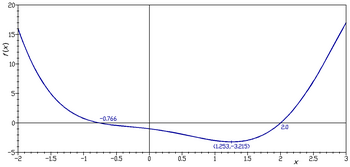
From the graph, the domain is recovered as the set of first component of each pair in the graph . Similarly, the range can be recovered as . The codomain , however, cannot be determined from the graph alone.


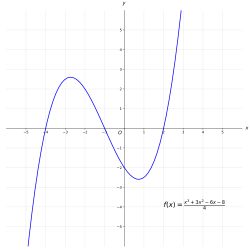
The graph of the cubic polynomial on the real line


If this set is plotted on a Cartesian plane, the result is a curve (see figure).
Functions of two variables
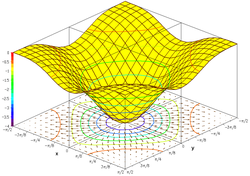

The graph of the trigonometric function


If this set is plotted on a three dimensional Cartesian coordinate system, the result is a surface (see figure).
Oftentimes it is helpful to show with the graph, the gradient of the function and several level curves. The level curves can be mapped on the function surface or can be projected on the bottom plane. The second figure shows such a drawing of the graph of the function:

See also
References
- ^ Charles C Pinter (2014) [1971]. A Book of Set Theory. Dover Publications. p. 49. ISBN 978-0-486-79549-2.
- ^ T. M. Apostol (1981). Mathematical Analysis. Addison-Wesley. p. 35.
- ^ P. R. Halmos (1982). A Hilbert Space Problem Book. Springer-Verlag. p. 31. ISBN 0-387-90685-1.
- ^ D. S. Bridges (1991). Foundations of Real and Abstract Analysis. Springer. p. 285. ISBN 0-387-98239-6.
Further reading
- Zălinescu, Constantin (30 July 2002). Convex Analysis in General Vector Spaces. River Edge, N.J. London: World Scientific Publishing. ISBN 978-981-4488-15-0. MR 1921556. OCLC 285163112 – via Internet Archive.
External links
- Weisstein, Eric W. "Function Graph." From MathWorld—A Wolfram Web Resource.
| Authority control databases: National |
|---|