
| Playford South Australia—House of Assembly | |||||||||||||||
|---|---|---|---|---|---|---|---|---|---|---|---|---|---|---|---|
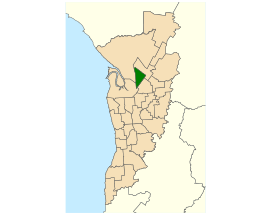 Electoral district of Playford (green) in the Greater Adelaide area | |||||||||||||||
| State | South Australia | ||||||||||||||
| Created | 1970 | ||||||||||||||
| MP | John Fulbrook | ||||||||||||||
| Party | Australian Labor Party (SA) | ||||||||||||||
| Namesake | Thomas Playford IV | ||||||||||||||
| Electors | 26,374 (2018) | ||||||||||||||
| Area | 24.61 km2 (9.5 sq mi) | ||||||||||||||
| Demographic | Metropolitan | ||||||||||||||
| Coordinates | 34°49′6″S 138°38′12″E / 34.81833°S 138.63667°E | ||||||||||||||
| |||||||||||||||
| Footnotes | |||||||||||||||
| Electoral District map[1] | |||||||||||||||
Playford is a single-member electoral district for the South Australian House of Assembly. Named after the long serving South Australian premier Tom Playford, it is a 22.7 km² suburban electorate in Adelaide's north, taking in the suburbs of Green Fields, Mawson Lakes, Para Hills, Para Hills West, Parafield and Parafield Gardens.
Playford was created as a safe Labor seat and was first contested at the 1970 election (interestingly, when Tom Playford was still alive), where it was won by Labor candidate Terry McRae. At the 1989 election, McRae resigned from politics, with the seat won by Labor candidate John Quirke. Though typically a safe Labor seat, the seat technically became marginal, reduced to just a 2.7 percent two-party margin at the 1993 election landslide. At the 1997 election, Quirke resigned to enter the Australian Senate, with the seat won by Labor candidate Jack Snelling.
YouTube Encyclopedic
-
1/3Views:4 6031 4812 785
-
Find Your 17th-c. New England Ancestors with NEHGS
-
O-Bahn Bus Access Tunnel construction has started Greater Adelaide Video July 2016
-
Charles Ives (Three Songs)
Transcription
Members for Playford
| Member | Party | Term | |
|---|---|---|---|
| Terry McRae | Labor | 1970–1989 | |
| John Quirke | Labor | 1989–1997 | |
| Jack Snelling | Labor | 1997–2018 | |
| Michael Brown | Labor | 2018–2022 | |
| John Fulbrook | Labor | 2022–present | |
Election results
| Party | Candidate | Votes | % | ±% | |
|---|---|---|---|---|---|
| Labor | John Fulbrook | 11,922 | 53.5 | +3.1 | |
| Liberal | Hemant Dave | 5,511 | 24.7 | +6.8 | |
| Greens | David Wright | 2,118 | 9.5 | +4.6 | |
| Family First | Rojan Jose | 1,773 | 8.0 | +8.0 | |
| Independent | Shane Quinn | 973 | 4.4 | +4.4 | |
| Total formal votes | 22,297 | 95.7 | |||
| Informal votes | 1,011 | 4.3 | |||
| Turnout | 23,308 | 87.4 | |||
| Two-party-preferred result | |||||
| Labor | John Fulbrook | 14,777 | 66.3 | −2.7 | |
| Liberal | Hemant Dave | 7,520 | 33.7 | +2.7 | |
| Labor hold | Swing | −2.7 | |||
Notes
- ^ Electoral District of Playford (Map). Electoral Commission of South Australia. 2018. Retrieved 1 April 2018.[permanent dead link]
References
- ECSA profile for Playford: 2018
- ABC profile for Playford: 2018
- Poll Bludger profile for Playford: 2018