
| California's 11th congressional district | |||
|---|---|---|---|
Interactive map of district boundaries since 2023 (Used in the 2022 elections) | |||
| Representative |
| ||
| Distribution |
| ||
| Population (2020[1]) | 760,067 | ||
| Median household income | $139,300[2] | ||
| Ethnicity |
| ||
| Cook PVI | D+37[3] | ||
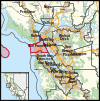

California's 11th congressional district is a congressional district in the U.S. state of California and is represented by Nancy Pelosi.
Before redistricting, the 11th district consisted of most of Contra Costa County. Mark DeSaulnier, a Democrat, represented the district from January 2015 to January 2023. Cities and CDPs in the district included Alamo, Bay Point, Blackhawk, Clayton, Concord, Diablo, El Cerrito, El Sobrante, Kensington, Lafayette, Moraga, Orinda, Pinole, Pittsburg, Pleasant Hill, San Pablo, Richmond, and Walnut Creek; most of Danville; and parts of Antioch and Martinez.[4]
Following redistricting in 2023 by the California Citizens Redistricting Commission, the 11th district is entirely in San Francisco, and includes most of the city with the exception of the Excelsior District, Visitacion Valley, Portola, and Ocean View on the city's southern edge.[5] Former Speaker of the House Nancy Pelosi represents the new 11th district.
YouTube Encyclopedic
-
1/2Views:1 116 812326
-
Congressional Elections: Crash Course Government and Politics #6
-
Ch 11 Congress lecture notes video
Transcription
Hi, I'm Craig and this is Crash Course Government and Politics, and today we're going to talk about what is, if you ask the general public, the most important part of politics: elections. If you ask me, it's hair styles. Look at Martin Van Buren's sideburns, how could he not be elected? Americans are kind of obsessed with elections, I mean when this was being recorded in early 2015, television, news and the internet were already talking about who would be Democrat and Republican candidates for president in 2016. And many of the candidates have unofficially been campaigning for years. I've been campaigning; your grandma's been campaigning. Presidential elections are exciting and you can gamble on them. Is that legal, can you gamble on them, Stan? Anyway, why we're so obsessed with them is a topic for another day. Right now I'm gonna tell you that the fixation on the presidential elections is wrong, but not because the president doesn't matter. No, today we're gonna look at the elections of the people that are supposed to matter the most, Congress. Constitutionally at least, Congress is the most important branch of government because it is the one that is supposed to be the most responsive to the people. One of the main reasons it's so responsive, at least in theory, is the frequency of elections. If a politician has to run for office often, he or she, because unlike the president we have women serving in Congress, kind of has to pay attention to what the constituents want, a little bit, maybe. By now, I'm sure that most of you have memorized the Constitution, so you recognize that despite their importance in the way we discuss politics, elections aren't really a big feature of the Constitution. Except of course for the ridiculously complex electoral college system for choosing the president, which we don't even want to think about for a few episodes. In fact, here's what the Constitution says about Congressional Elections in Article 1 Section 2: "The House of Representatives shall be composed of members chosen every second year by the people of the several states, and the electors in each state shall have the qualifications requisite for electors of the most numerous branch of the state legislature." So the Constitution does establish that the whole of the house is up for election every 2 years, and 1/3 of the senate is too, but mainly it leaves the scheduling and rules of elections up to the states. The actual rules of elections, like when the polls are open and where they actually are, as well as the registration requirements, are pretty much up to the states, subject to some federal election law. If you really want to know the rules in your state, I'm sure that someone at the Board of Elections, will be happy to explain them to you. Really, you should give them a call; they're very, very lonely. In general though, here's what we can say about American elections. First stating the super obvious, in order to serve in congress, you need to win an election. In the House of Representatives, each election district chooses a single representative, which is why we call them single-member districts. The number of districts is determined by the Census, which happens every 10 years, and which means that elections ending in zeros are super important, for reasons that I'll explain in greater detail in a future episode. It's because of gerrymandering. The Senate is much easier to figure out because both of the state Senators are elected by the entire state. It's as if the state itself were a single district, which is true for states like Wyoming, which are so unpopulated as to have only 1 representative. Sometimes these elections are called at large elections. Before the election ever happens, you need candidates. How candidates are chosen differs from state to state, but usually it has something to do with political parties, although it doesn't have to. Why are things so complicated?! What we can say is that candidates, or at least good candidates, usually have certain characteristics. Sorry America. First off, if you are gonna run for office, you should have an unblemished record, free of, oh I don't know, felony convictions or sex scandals, except maybe in Louisiana or New York. This might lead to some pretty bland candidates or people who are so calculating that they have no skeletons in their closet, but we Americans are a moral people and like our candidates to reflect our ideals rather than our reality. The second characteristic that a candidate must possess is the ability to raise money. Now some candidates are billionaires and can finance their own campaigns. But most billionaires have better things to do: buying yachts, making even more money, building money forts, buying more yachts, so they don't have time to run for office. But most candidates get their money for their campaigns by asking for it. The ability to raise money is key, especially now, because running for office is expensive. Can I get a how expensive is it? "How expensive is it?!" Well, so expensive that the prices of elections continually rises and in 2012 winners of House races spent nearly 2 million each. Senate winners spent more than 10 million. By the time this episode airs, I'm sure the numbers will be much higher like a gajillion billion million. Money is important in winning an election, but even more important, statistically, is already being in Congress. Let's go to the Thought Bubble. The person holding an office who runs for that office again is called the incumbent and has a big advantage over any challenger. This is according to political scientists who, being almost as bad at naming things as historians, refer to this as incumbency advantage. There are a number of reasons why incumbents tend to hold onto their seats in congress, if they want to. The first is that a sitting congressman has a record to run on, which we hope includes some legislative accomplishments, although for the past few Congresses, these don't seem to matter. The record might include case work, which is providing direct services to constituents. This is usually done by congressional staffers and includes things like answering questions about how to get certain government benefits or writing recommendation letters to West Point. Congressmen can also provide jobs to constituents, which is usually a good way to get them to vote for you. These are either government jobs, kind of rare these days, called patronage or indirect employment through government contracts for programs within a Congressman's district. These programs are called earmarks or pork barrel programs, and they are much less common now because Congress has decided not to use them any more, sort of. The second advantage that incumbents have is that they have a record of winning elections, which if you think about it, is pretty obvious. Being a proven winner makes it easier for a congressmen to raise money, which helps them win, and long term incumbents tend to be more powerful in Congress which makes it even easier for them to raise money and win. The Constitution give incumbents one structural advantage too. Each elected congressman is allowed $100,000 and free postage to send out election materials. This is called the franking privilege. It's not so clear how great an advantage this is in the age of the internet, but at least according to the book The Victory Lab, direct mail from candidates can be surprisingly effective. How real is this incumbency advantage? Well if you look at the numbers, it seems pretty darn real. Over the past 60 years, almost 90% of members of The House of Representatives got re-elected. The Senate has been even more volatile, but even at the low point in 1980 more than 50% of sitting senators got to keep their jobs. Thanks, Thought Bubble. You're so great. So those are some of the features of congressional elections. Now, if you'll permit me to get a little politically sciencey, I'd like to try to explain why elections are so important to the way that Congressmen and Senators do their jobs. In 1974, political scientist David Mayhew published a book in which he described something he called "The Electoral Connection." This was the idea that Congressmen were primarily motivated by the desire to get re-elected, which intuitively makes a lot of sense, even though I'm not sure what evidence he had for this conclusion. Used to be able to get away with that kind of thing I guess, clearly David may-not-hew to the rules of evidence, pun [rim shot], high five, no. Anyway Mayhew's research methodology isn't as important as his idea itself because The Electoral Connection provides a frame work for understanding congressman's activities. Mayhew divided representatives' behaviors and activities into three categories. The first is advertising; congressmen work to develop their personal brand so that they are recognizable to voters. Al D'Amato used to be know in New York as Senator Pothole, because he was able to bring home so much pork that he could actually fix New York's streets. Not by filling them with pork, money, its money, remember pork barrel spending? The second activity is credit claiming; Congressmen get things done so that they can say they got them done. A lot of case work and especially pork barrel spending are done in the name of credit claiming. Related to credit claiming, but slightly different, is position taking. This means making a public judgmental statement on something likely to be of interest to voters. Senators can do this through filibusters. Representatives can't filibuster, but they can hold hearings, publicly supporting a hearing is a way of associating yourself with an idea without having to actually try to pass legislation. And of course they can go on the TV, especially on Sunday talk shows. What's a TV, who even watches TV? Now the idea of The Electoral Connection doesn't explain every action a member of Congress takes; sometimes they actually make laws to benefit the public good or maybe solve problems, huh, what an idea! But Mayhew's idea gives us a way of thinking about Congressional activity, an analytical lens that connects what Congressmen actually do with how most of us understand Congressmen, through elections. So the next time you see a Congressmen call for a hearing on a supposed horrible scandal or read about a Senator threatening to filibuster a policy that may have significant popular support, ask yourself, "Is this Representative claiming credit or taking a position, and how will this build their brand?" In other words: what's the electoral connection and how will whatever they're doing help them get elected? This might feel a little cynical, but the reality is Mayhew's thesis often seems to fit with today's politics. Thanks for watching, see you next week. Vote for me; I'm on the TV. I'm not -- I'm on the YouTube. Crash Course: Government and Politics is produced in association with PBS Digital Studios. Support for Crash Course US Government comes from Voqal. Voqal supports nonprofits that use technology and media to advance social equity. Learn more about their mission and initiatives at Voqal.org. Crash Course is made by all of these nice people. Thanks for watching. That guy isn't nice.
Election results from statewide races
Composition
| # | County | Seat | Population |
|---|---|---|---|
| 75 | San Francisco | San Francisco | 815,201 |
Due to the 2020 redistricting, California's 11th district has effectively been shifted to the former geography of the 12th district. The district encompasses the city of San Francisco almost entirely, except for the neighborhoods of Crocker Amazon, Excelsior, Little Hollywood, Mission Terrace, Oceanview, Outer Mission, Portola, and Visitacion Valley.
Cities
- San Francisco - 815,201
List of members representing the district


Election results
1912
| Party | Candidate | Votes | % | |||
|---|---|---|---|---|---|---|
| Democratic | William Kettner | 24,822 | 42.7 | |||
| Republican | Samuel C. Evans | 21,426 | 36.8 | |||
| Socialist | Noble A. Richardson | 7,059 | 12.1 | |||
| Prohibition | Helen M. Stoddard | 4,842 | 8.3 | |||
| Total votes | 46,248 | 100.0 | ||||
| Turnout | ||||||
| Democratic gain from Republican | ||||||
1914
| Party | Candidate | Votes | % | |
|---|---|---|---|---|
| Democratic | William Kettner (Incumbent) | 47,165 | 52.7 | |
| Republican | James Carson Needham | 25,001 | 27.9 | |
| Prohibition | James S. Edwards | 11,278 | 12.7 | |
| Socialist | Casper Bauer | 6,033 | 6.7 | |
| Total votes | 89,477 | 100.0 | ||
| Turnout | ||||
| Democratic hold | ||||
1916
| Party | Candidate | Votes | % | |
|---|---|---|---|---|
| Democratic | William Kettner (Incumbent) | 42,051 | 44.5 | |
| Republican | Robert C. Harbison | 33,765 | 35.7 | |
| Prohibition | James S. Edwards | 14,759 | 15.6 | |
| Socialist | Marcus W. Robbins | 3,913 | 4.1 | |
| Total votes | 94,488 | 100.0 | ||
| Turnout | ||||
| Democratic hold | ||||
1918
| Party | Candidate | Votes | % | |
|---|---|---|---|---|
| Democratic | William Kettner (Incumbent) | 45,915 | 72.2 | |
| Prohibition | Stella B. Irvine | 17,642 | 27.8 | |
| Total votes | 63,557 | 100.0 | ||
| Turnout | ||||
| Democratic hold | ||||
1920
| Party | Candidate | Votes | % | |||
|---|---|---|---|---|---|---|
| Republican | Phil Swing | 59,425 | 72.9 | |||
| Democratic | Hugh L. Dickson | 22,144 | 27.1 | |||
| Total votes | 81,569 | 100.0 | ||||
| Turnout | ||||||
| Republican gain from Democratic | ||||||
1922
| Party | Candidate | Votes | % | |
|---|---|---|---|---|
| Republican | Phil Swing (Incumbent) | 79,039 | 91.4 | |
| Prohibition | Charles H. Randall | 7,466 | 8.6 | |
| Total votes | 86,505 | 100.0 | ||
| Turnout | ||||
| Republican hold | ||||
1924
| Party | Candidate | Votes | % | |
|---|---|---|---|---|
| Republican | Phil Swing (Incumbent) | 93,811 | 100.0 | |
| Turnout | ||||
| Republican hold | ||||
1926
| Party | Candidate | Votes | % | |
|---|---|---|---|---|
| Republican | Phil Swing (Incumbent) | 89,726 | 100.0 | |
| Turnout | ||||
| Republican hold | ||||
1928
| Party | Candidate | Votes | % | |
|---|---|---|---|---|
| Republican | Phil Swing (Incumbent) | 127,115 | 100.0 | |
| Turnout | ||||
| Republican hold | ||||
1930
| Party | Candidate | Votes | % | |
|---|---|---|---|---|
| Republican | Phil Swing (Incumbent) | 124,092 | 100.0 | |
| Turnout | ||||
| Republican hold | ||||
1932
| Party | Candidate | Votes | % | |
|---|---|---|---|---|
| Republican | William E. Evans (Incumbent) | 57,739 | 51.8 | |
| Democratic | Albert D. Hadley | 38,240 | 34.3 | |
| Liberty | Marshall V. Hartranft | 15,520 | 13.9 | |
| Total votes | 111,499 | 100.0 | ||
| Turnout | ||||
| Republican hold | ||||
1934
| Party | Candidate | Votes | % | |||
|---|---|---|---|---|---|---|
| Democratic | John S. McGroarty | 66,999 | 53.5 | |||
| Republican | William E. Evans (Incumbent) | 56,350 | 45.0 | |||
| Socialist | William E. Stephenson | 1,814 | 1.5 | |||
| Total votes | 125,163 | 100.0 | ||||
| Turnout | ||||||
| Democratic gain from Republican | ||||||
1936
| Party | Candidate | Votes | % | |
|---|---|---|---|---|
| Democratic | John S. McGroarty (Incumbent) | 69,679 | 50.5 | |
| Republican | John Carl Hinshaw | 54,914 | 39.8 | |
| Progressive | Robert S. Funk | 12,340 | 8.9 | |
| Communist | William Ingham | 1,041 | 0.8 | |
| Total votes | 137,974 | 100.0 | ||
| Turnout | ||||
| Democratic hold | ||||
1938
| Party | Candidate | Votes | % | |||
|---|---|---|---|---|---|---|
| Republican | John Carl Hinshaw | 68,712 | 47.0 | |||
| Democratic | Carl Stuart Hamblen | 59,993 | 41.1 | |||
| Townsend | Ralph D. Horton | 12,713 | 8.7 | |||
| Progressive | John R. Grey | 3,821 | 2.6 | |||
| Communist | Orla E. Lair | 817 | 0.6 | |||
| Total votes | 146,056 | 100.0 | ||||
| Turnout | ||||||
| Republican gain from Democratic | ||||||
1940
| Party | Candidate | Votes | % | |
|---|---|---|---|---|
| Republican | John Carl Hinshaw (Incumbent) | 170,504 | 96.6 | |
| Communist | Orla E. Lair | 6,003 | 3.4 | |
| Total votes | 176,507 | 100.0 | ||
| Turnout | ||||
| Republican hold | ||||
1942
| Party | Candidate | Votes | % | ||
|---|---|---|---|---|---|
| Democratic | George E. Outland | 31,611 | 50.7 | ||
| Republican | A. J. Dingeman | 30,781 | 49.3 | ||
| Total votes | 62,392 | 100.0 | |||
| Turnout | |||||
| Democratic win (new seat) | |||||
1944
| Party | Candidate | Votes | % | |
|---|---|---|---|---|
| Democratic | George E. Outland (Incumbent) | 52,218 | 56 | |
| Republican | A. J. Dingeman | 41,005 | 44 | |
| Total votes | 93,223 | 100 | ||
| Turnout | ||||
| Democratic hold | ||||
1946
| Party | Candidate | Votes | % | |||
|---|---|---|---|---|---|---|
| Republican | Ernest K. Bramblett | 41,902 | 53.1 | |||
| Democratic | George E. Outland (Incumbent) | 36,996 | 46.9 | |||
| Total votes | 78,898 | 100.0 | ||||
| Turnout | ||||||
| Republican gain from Democratic | ||||||
1948
| Party | Candidate | Votes | % | |
|---|---|---|---|---|
| Republican | Ernest K. Bramblett (Incumbent) | 87,143 | 80.8 | |
| Progressive | Cole Weston | 14,582 | 13.5 | |
| Democratic | George E. Outland (write-in) | 6,157 | 5.7 | |
| Total votes | 107,882 | 100.0 | ||
| Turnout | ||||
| Republican hold | ||||
1950
| Party | Candidate | Votes | % | |
|---|---|---|---|---|
| Republican | Ernest K. Bramblett (Incumbent) | 59,780 | 52.1 | |
| Democratic | Ardis M. Walker | 55,020 | 47.9 | |
| Total votes | 114,800 | 100.0 | ||
| Turnout | ||||
| Republican hold | ||||
1952
| Party | Candidate | Votes | % | |
|---|---|---|---|---|
| Republican | Justin L. Johnson (Incumbent) | 101,052 | 87.1 | |
| Progressive | Leslie B. Schilingheyde | 14,999 | 12.9 | |
| Total votes | 116,051 | 100.0 | ||
| Turnout | ||||
| Republican hold | ||||
1954
| Party | Candidate | Votes | % | |
|---|---|---|---|---|
| Republican | Justin L. Johnson (Incumbent) | 54,716 | 52.6 | |
| Democratic | Carl Sugar | 49,388 | 47.4 | |
| Total votes | 104,104 | 100.0 | ||
| Turnout | ||||
| Republican hold | ||||
1956
| Party | Candidate | Votes | % | |||
|---|---|---|---|---|---|---|
| Democratic | John J. McFall | 70,630 | 53.1 | |||
| Republican | Justin L. Johnson (Incumbent) | 62,448 | 46.9 | |||
| Total votes | 133,078 | 100.0 | ||||
| Turnout | ||||||
| Democratic gain from Republican | ||||||
1958
| Party | Candidate | Votes | % | |
|---|---|---|---|---|
| Democratic | John J. McFall (Incumbent) | 86,924 | 69.3 | |
| Republican | Frederick S. Van Dyke | 38,427 | 30.7 | |
| Total votes | 125,351 | 100.0 | ||
| Turnout | ||||
| Democratic hold | ||||
1960
| Party | Candidate | Votes | % | |
|---|---|---|---|---|
| Democratic | John J. McFall (Incumbent) | 97,368 | 65.4 | |
| Republican | Clifford B. Bull | 51,473 | 34.6 | |
| Total votes | 148,841 | 100.0 | ||
| Turnout | ||||
| Democratic hold | ||||
1962
| Party | Candidate | Votes | % | |
|---|---|---|---|---|
| Republican | J. Arthur Younger (Incumbent) | 101,963 | 62.3 | |
| Democratic | John D. Kaster | 61,623 | 37.7 | |
| Total votes | 163,586 | 100.0 | ||
| Turnout | ||||
| Republican hold | ||||
1964
| Party | Candidate | Votes | % | |
|---|---|---|---|---|
| Republican | J. Arthur Younger (Incumbent) | 116,022 | 54.8 | |
| Democratic | W. Mark Sullivan | 95,747 | 45.2 | |
| Total votes | 211,769 | 100.0 | ||
| Turnout | ||||
| Republican hold | ||||
1966
| Party | Candidate | Votes | % | |
|---|---|---|---|---|
| Republican | J. Arthur Younger (Incumbent) | 113,679 | 59.4 | |
| Democratic | W. Mark Sullivan | 77,605 | 40.6 | |
| Total votes | 191,284 | 100.0 | ||
| Turnout | ||||
| Republican hold | ||||
1967 (Special)
| Party | Candidate | Votes | % | |
|---|---|---|---|---|
| Republican | Pete McCloskey | 63,850 | 57.2 | |
| Democratic | Roy A. Archibald | 43,759 | 39.2 | |
| Independent | Shirley Temple | 3,938 | 3.5 | |
| Total votes | 111,547 | 100.0 | ||
| Turnout | ||||
| Republican hold | ||||
1968
| Party | Candidate | Votes | % | |
|---|---|---|---|---|
| Republican | Pete McCloskey (Incumbent) | 165,482 | 79.3 | |
| Democratic | Urban G. Whitaker Jr. | 40,979 | 19.6 | |
| Peace and Freedom | David Demorest Ransom | 2,157 | 1.0 | |
| Total votes | 208,618 | 100.0 | ||
| Turnout | ||||
| Republican hold | ||||
1970
| Party | Candidate | Votes | % | |
|---|---|---|---|---|
| Republican | Pete McCloskey (Incumbent) | 144,500 | 77.5 | |
| Democratic | Robert E. Gomperts | 39,188 | 21.0 | |
| Independent | Scattering | 2,786 | 1.5 | |
| Total votes | 186,474 | 100.0 | ||
| Turnout | ||||
| Republican hold | ||||
1972
| Party | Candidate | Votes | % | ||
|---|---|---|---|---|---|
| Democratic | Leo Ryan | 113,580 | 60.4 | ||
| Republican | Charles E. Chase | 69,655 | 37.0 | ||
| American Independent | Nicholas Waeil Kudrovzeff | 4,852 | 2.6 | ||
| Total votes | 188,087 | 100.0 | |||
| Turnout | |||||
| Democratic win (new seat) | |||||
1974
| Party | Candidate | Votes | % | |
|---|---|---|---|---|
| Democratic | Leo Ryan (Incumbent) | 106,075 | 75.8 | |
| Republican | Bob Jones | 29,783 | 21.3 | |
| American Independent | Nicholas Waeil Kudrovzeff | 4,293 | 2.9 | |
| Total votes | 140,151 | 100.0 | ||
| Turnout | ||||
| Democratic hold | ||||
1976
| Party | Candidate | Votes | % | |
|---|---|---|---|---|
| Democratic | Leo Ryan (Incumbent) | 107,618 | 61.1 | |
| Republican | Bob Jones | 62,435 | 35.4 | |
| American Independent | Nicholas Waeil Kudrovzeff | 6,141 | 3.5 | |
| Total votes | 176,194 | 100.0 | ||
| Turnout | ||||
| Democratic hold | ||||
1978
| Party | Candidate | Votes | % | |
|---|---|---|---|---|
| Democratic | Leo Ryan (Incumbent) | 92,882 | 60.5 | |
| Republican | Dave Welch | 54,621 | 35.6 | |
| American Independent | Nicholas Waeil Kudrovzeff | 5,961 | 3.9 | |
| Total votes | 153,464 | 100.0 | ||
| Turnout | ||||
| Democratic hold | ||||
1979 (Special)
| Party | Candidate | Votes | % | |||
|---|---|---|---|---|---|---|
| Republican | William Royer | 52,585 | 57.3 | |||
| Democratic | G.W. "Joe" Holsinger | 37,685 | 41.1 | |||
| American Independent | Nicholas W. Kudrovzeff | 770 | 0.8 | |||
| Peace and Freedom | Wilson G. Branch | 731 | 0.8 | |||
| Total votes | 91,771 | 100.0 | ||||
| Turnout | ||||||
| Republican gain from Democratic | ||||||
1980
| Party | Candidate | Votes | % | |||
|---|---|---|---|---|---|---|
| Democratic | Tom Lantos | 85,823 | 46.4 | |||
| Republican | William Royer (Incumbent) | 80,100 | 43.3 | |||
| Peace and Freedom | Wilson G. Branch | 13,723 | 7.4 | |||
| Libertarian | William S. Wade Jr. | 3,816 | 2.1 | |||
| American Independent | Nicholas W. Kudrovzeff | 1,550 | 0.8 | |||
| Total votes | 185,012 | 100.0 | ||||
| Turnout | ||||||
| Democratic gain from Republican | ||||||
1982
| Party | Candidate | Votes | % | |
|---|---|---|---|---|
| Democratic | Tom Lantos (Incumbent) | 109,812 | 57.1 | |
| Republican | William Royer | 76,462 | 39.7 | |
| Libertarian | Chuck Olson | 2,920 | 1.5 | |
| Peace and Freedom | Wilson G. Branch | 1,928 | 1.0 | |
| American Independent | Nicholas W. Kudrovzeff | 1,250 | 0.6 | |
| Total votes | 192,372 | 100.0 | ||
| Turnout | ||||
| Democratic hold | ||||
1984
| Party | Candidate | Votes | % | |
|---|---|---|---|---|
| Democratic | Tom Lantos (Incumbent) | 147,607 | 69.9 | |
| Republican | John J. "Jack" Hickey | 59,625 | 28.2 | |
| American Independent | Nicholas W. Kudrovzeff | 3,883 | 1.8 | |
| Total votes | 211,115 | 100.0 | ||
| Turnout | ||||
| Democratic hold | ||||
1986
| Party | Candidate | Votes | % | |
|---|---|---|---|---|
| Democratic | Tom Lantos (Incumbent) | 112,380 | 74.1 | |
| Republican | Bill Quarishi | 39,315 | 25.9 | |
| Total votes | 151,695 | 100.0 | ||
| Turnout | ||||
| Democratic hold | ||||
1988
| Party | Candidate | Votes | % | |
|---|---|---|---|---|
| Democratic | Tom Lantos (Incumbent) | 145,484 | 71.0 | |
| Republican | Bill Quarishi | 50,050 | 24.4 | |
| Libertarian | Bill Wade | 4,683 | 2.3 | |
| Peace and Freedom | Victor Martinez | 2,906 | 1.4 | |
| American Independent | Nicholas W. Kudrovzeff | 1,893 | 0.9 | |
| Total votes | 205,016 | 100.0 | ||
| Turnout | ||||
| Democratic hold | ||||
1990
| Party | Candidate | Votes | % | |
|---|---|---|---|---|
| Democratic | Tom Lantos (Incumbent) | 105,029 | 65.9 | |
| Republican | Bill Quarishi | 45,818 | 28.8 | |
| Libertarian | June R. Genis | 8,518 | 5.3 | |
| Total votes | 159,365 | 100.0 | ||
| Turnout | ||||
| Democratic hold | ||||
1992
| Party | Candidate | Votes | % | ||
|---|---|---|---|---|---|
| Republican | Richard Pombo | 94,453 | 47.6 | ||
| Democratic | Patti Garamendi | 90,539 | 45.6 | ||
| Libertarian | Christine Roberts | 13,498 | 6.8 | ||
| Total votes | 198,490 | 100.0 | |||
| Turnout | |||||
| Republican win (new seat) | |||||
1994
| Party | Candidate | Votes | % | |
|---|---|---|---|---|
| Republican | Richard Pombo (Incumbent) | 99,302 | 62.14 | |
| Democratic | Randy A. Perry | 55,794 | 34.91 | |
| Libertarian | Joseph B. Miller | 4,718 | 2.95 | |
| Total votes | 159,814 | 100.0 | ||
| Turnout | ||||
| Republican hold | ||||
1996
| Party | Candidate | Votes | % | |
|---|---|---|---|---|
| Republican | Richard Pombo (Incumbent) | 107,477 | 59.4 | |
| Democratic | Jason Silva | 65,536 | 36.2 | |
| Libertarian | Kelly Rego | 5,077 | 2.8 | |
| Natural Law | Selene Bush | 3,006 | 1.6 | |
| Total votes | 181,096 | 100.0 | ||
| Turnout | ||||
| Republican hold | ||||
1998
| Party | Candidate | Votes | % | |
|---|---|---|---|---|
| Republican | Richard Pombo (Incumbent) | 95,496 | 61.43 | |
| Democratic | Robert L. Figueroa | 56,345 | 36.25 | |
| Libertarian | Jesse Baird | 3,608 | 2.32 | |
| Total votes | 155,449 | 100.0 | ||
| Turnout | ||||
| Republican hold | ||||
2000
| Party | Candidate | Votes | % | |
|---|---|---|---|---|
| Republican | Richard Pombo (Incumbent) | 120,635 | 57.9 | |
| Democratic | Tom Y. Santos | 79,539 | 38.1 | |
| Libertarian | Kathryn A. Russow | 5,036 | 2.4 | |
| Natural Law | Jon A. Kurey | 3,397 | 1.6 | |
| Total votes | 208,607 | 100.0 | ||
| Turnout | ||||
| Republican hold | ||||
2002
| Party | Candidate | Votes | % | |
|---|---|---|---|---|
| Republican | Richard Pombo (Incumbent) | 104,921 | 60.4 | |
| Democratic | Elaine Shaw | 69,035 | 39.6 | |
| Total votes | 173,956 | 100.0 | ||
| Turnout | ||||
| Republican hold | ||||
2004
| Party | Candidate | Votes | % | |
|---|---|---|---|---|
| Republican | Richard Pombo (Incumbent) | 163,582 | 61.3 | |
| Democratic | Jerry McNerney | 103,587 | 38.7 | |
| Total votes | 267,169 | 100.0 | ||
| Turnout | ||||
| Republican hold | ||||
2006
| Party | Candidate | Votes | % | |||
|---|---|---|---|---|---|---|
| Democratic | Jerry McNerney | 109,868 | 53.3 | |||
| Republican | Richard Pombo (Incumbent) | 96,396 | 46.7 | |||
| Total votes | 206,264 | 100.0 | ||||
| Turnout | ||||||
| Democratic gain from Republican | ||||||
2008
| Party | Candidate | Votes | % | |
|---|---|---|---|---|
| Democratic | Jerry McNerney (Incumbent) | 164,500 | 55.3 | |
| Republican | Dean Andal | 133,104 | 44.7 | |
| Total votes | 297,616 | 100.0 | ||
| Turnout | ||||
| Democratic hold | ||||
2010
| Party | Candidate | Votes | % | |
|---|---|---|---|---|
| Democratic | Jerry McNerney (Incumbent) | 115,361 | 47.97 | |
| Republican | David Harmer | 112,703 | 46.86 | |
| American Independent | David Christensen | 12,439 | 5.17 | |
| Total votes | 240,503 | 100.00 | ||
| Democratic hold | ||||
2012
| Party | Candidate | Votes | % | |
|---|---|---|---|---|
| Democratic | George Miller (Incumbent) | 200,743 | 69.7 | |
| Republican | Virginia Fuller | 87,136 | 30.3 | |
| Total votes | 287,879 | 100.0 | ||
| Democratic hold | ||||
2014
| Party | Candidate | Votes | % | |
|---|---|---|---|---|
| Democratic | Mark DeSaulnier | 117,502 | 67% | |
| Republican | Tue Phan | 57,160 | 33% | |
| Total votes | 174,662 | 100.0% | ||
| Democratic hold | ||||
2016
| Party | Candidate | Votes | % | |
|---|---|---|---|---|
| Democratic | Mark DeSaulnier (Incumbent) | 214,868 | 72% | |
| Republican | Roger A. Petersen | 83,341 | 28% | |
| Total votes | 298,209 | 100.0% | ||
| Democratic hold | ||||
2018
| Party | Candidate | Votes | % | |
|---|---|---|---|---|
| Democratic | Mark DeSaulnier (Incumbent) | 204,369 | 74% | |
| Republican | John Fitzgerald | 71,312 | 25% | |
| Total votes | 275,681 | 100.0% | ||
| Democratic hold | ||||
2020
| Party | Candidate | Votes | % | |
|---|---|---|---|---|
| Democratic | Mark DeSaulnier (incumbent) | 271,063 | 73.0 | |
| Republican | Nisha Sharma | 100,293 | 27.0 | |
| Total votes | 371,356 | 100.0 | ||
| Democratic hold | ||||
2022
| Party | Candidate | Votes | % | |
|---|---|---|---|---|
| Democratic | Nancy Pelosi (incumbent) | 220,848 | 84.0 | |
| Republican | John Dennis | 42,217 | 16.0 | |
| Total votes | 263,065 | 100.0 | ||
| Democratic hold | ||||
See also
References
- ^ "California Citizens Redistricting Commission" (PDF).
- ^ "My Congressional District".
- ^ "2022 Cook PVI: District Map and List". Cook Political Report. July 12, 2022. Retrieved January 10, 2023.
- ^ "Maps: Final Congressional Districts". Citizens Redistricting Commission. Archived from the original on March 10, 2013. Retrieved February 24, 2013.
- ^ "CA 2022 Congressional". Dave's Redistricting. January 4, 2022. Retrieved November 11, 2022.
- ^ "Supplement To The Statement Of Vote - November 3, 1998 General Election Counties by Congressional Districts" (PDF). Archived from the original (PDF) on September 29, 2011. Retrieved July 24, 2011.
- ^ "Supplement to the Statement of Vote - November 3, 1998 Election Counties by Congressional Districts" (PDF). Archived from the original (PDF) on September 29, 2011. Retrieved July 24, 2011.
- ^ "Statement of Vote (2000 President)" (PDF). Archived from the original (PDF) on June 11, 2007. Retrieved September 17, 2008.
- ^ "Statement of Vote (2000 Senator)" (PDF). Archived from the original (PDF) on June 11, 2007. Retrieved September 17, 2008.
- ^ Statement of Vote (2002 Governor) Archived 2010-11-11 at the Wayback Machine
- ^ "Statement of Vote (2003 Recall Question)" (PDF). Archived from the original (PDF) on May 20, 2011. Retrieved October 8, 2007.
- ^ "Statement of Vote (2003 Governor)" (PDF). Archived from the original (PDF) on May 20, 2011. Retrieved October 8, 2007.
- ^ "Statement of Vote (2004 President)" (PDF). Archived from the original (PDF) on August 1, 2010. Retrieved August 8, 2007.
- ^ Statement of Vote (2004 Senator) Archived 2011-08-10 at the Wayback Machine
- ^ Statement of Vote (2006 Governor) Archived 2011-08-10 at the Wayback Machine
- ^ Statement of Vote (2006 Senator) Archived 2011-08-10 at the Wayback Machine
- ^ "(2008 President)". Archived from the original on February 11, 2009. Retrieved March 5, 2009.
- ^ "Supplement to the Statement of Vote - Counties by Congressional Districts for Governor" (PDF). Archived from the original (PDF) on June 1, 2011. Retrieved July 24, 2011.
- ^ "Supplement to the Statement of Vote - Counties by Congressional Districts for United States Senator" (PDF). Archived from the original (PDF) on June 1, 2011. Retrieved July 24, 2011.
- ^ Supplement to the Statement of Vote - Counties by Congressional Districts for United States Senator
- ^ Supplement to the Statement of Vote - Counties by Congressional Districts for Governor
- ^ Supplement to the Statement of Vote - Counties by Congressional Districts for United States Senator
- ^ Supplement to the Statement of Vote - Counties by Congressional Districts for Governor
- ^ Supplement to the Statement of Vote - Counties by Congressional Districts for United States Senator
- ^ "Counties by Congressional District for Recall Question" (PDF). sos.ca.gov. September 14, 2021. Retrieved May 2, 2022.
- ^ "Counties by Congressional Districts for Governor" (PDF). sos.ca.gov. November 8, 2022. Retrieved May 4, 2023.
- ^ 1920 election results
- ^ 1922 election results
- ^ 1924 election results
- ^ 1926 election results
- ^ 1928 election results
- ^ 1930 election results
- ^ 1932 election results
- ^ 1934 election results
- ^ 1936 election results
- ^ 1938 election results
- ^ 1940 election results
- ^ 1942 election results
- ^ 1944 election results
- ^ 1946 election results
- ^ 1948 election results
- ^ 1950 election results
- ^ 1952 election results
- ^ 1954 election results
- ^ 1956 election results
- ^ 1958 election results
- ^ 1960 election results
- ^ 1962 election results
- ^ 1964 election results
- ^ 1966 election results
- ^ Michael J. Dubin, United States Congressional Elections, 1788-1997: The Official Results, McFarland & Company Inc, Jefferson, North Carolina, 1998, p. 656.
- ^ 1968 election results
- ^ 1970 election results
- ^ 1972 election results
- ^ 1974 election results
- ^ 1976 election results
- ^ 1978 election results
- ^ Michael J. Dubin, United States Congressional Elections, 1788-1997: The Official Results, McFarland & Company Inc, Jefferson, North Carolina, 1998, p. 714.
- ^ 1980 election results
- ^ 1982 election results
- ^ 1984 election results
- ^ 1986 election results
- ^ 1988 election results
- ^ 1990 election results
- ^ 1992 election results
- ^ 1994 election results
- ^ 1996 election results
- ^ 1998 election results
- ^ 2000 election results
- ^ 2002 general election results Archived February 3, 2009, at the Wayback Machine
- ^ 2004 general election results Archived 2008-08-21 at the Wayback Machine
- ^ 2006 general election results Archived November 27, 2008, at the Wayback Machine
- ^ 2012 general election results Archived October 19, 2013, at the Wayback Machine
- ^ 2014 general election results
External links
- GovTrack.us: California's 11th congressional district
- RAND California Election Returns: District Definitions (out of date)
- California Voter Foundation map - CD11 (out of date)
37°54′N 122°00′W / 37.9°N 122.0°W