To install click the Add extension button. That's it.

The source code for the WIKI 2 extension is being checked by specialists of the Mozilla Foundation, Google, and Apple. You could also do it yourself at any point in time.

4,5
Kelly Slayton
Congratulations on this excellent venture… what a great idea!
Alexander Grigorievskiy
I use WIKI 2 every day and almost forgot how the original Wikipedia looks like.
Live Statistics
English Articles
Improved in 24 Hours
Added in 24 Hours
Languages
Recent
Show all languages
What we do. Every page goes through several hundred of perfecting techniques; in live mode. Quite the same Wikipedia. Just better.
.
Leo
Newton
Brights
Milds

1995 Cape Verdean parliamentary election

From Wikipedia, the free encyclopedia

1995 Cape Verdean parliamentary election

← 1991 17 December 1995 2001 →

All 72 seats in the National Assembly
37 seats needed for a majority
Registered207,648
Turnout76.52%
  First party Second party Third party
 
Leader Carlos Veiga Pedro Pires Jorge Carlos Fonseca
Party MpD PAICV PCD
Seats won 50 21 1
Seat change Decrease 6 Decrease 2 New
Popular vote 93,249 45,263 10,211
Percentage 61.30% 29.75% 6.71%


Prime Minister before election

Carlos Veiga
MpD

Elected Prime Minister

Carlos Veiga
MpD

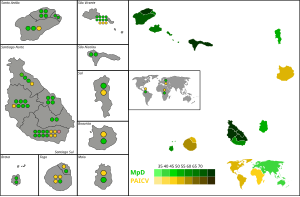
Parliamentary elections were held in Cape Verde on 17 December 1995. The number of seats was reduced from 79 to 72. The result was a victory for the ruling Movement for Democracy, which won 50 of the 72 seats.[1] Voter turnout was 76.52%.[2]

YouTube Encyclopedic

  • 1/3
    Views:
    2 987
    2 953
    34 194
  • Amilcar Cabral Announces National Assembly in Liberated Regions of Guinea-Bissau | Nov. 1972
  • Cape Verde & Sao Tome Principe: Commonalities & Differences of Two Lusophone Countries
  • Who did the Spanish and Portuguese really enslave? // Facts Vs. Fiction // Alex Haley, Roots Hoax !

Transcription

Results

PartyVotes%Seats+/–
Movement for Democracy93,24961.3050–6
African Party for the Independence of Cape Verde45,26329.7521–2
Democratic Convergence Party10,2116.711New
Democratic and Independent Cape Verdean Union2,3691.560New
Social Democratic Party1,0300.680New
Total152,122100.0072–7
Valid votes152,12295.73
Invalid/blank votes6,7794.27
Total votes158,901100.00
Registered voters/turnout207,64876.52
Source: African Elections Database

References

This page was last edited on 30 November 2022, at 20:28
Basis of this page is in Wikipedia. Text is available under the CC BY-SA 3.0 Unported License. Non-text media are available under their specified licenses. Wikipedia® is a registered trademark of the Wikimedia Foundation, Inc. WIKI 2 is an independent company and has no affiliation with Wikimedia Foundation.